When trading for last week ended on Friday, Singapore’s benchmark Straits Times Index, or STI, fell by about 50 points (or 1.85%) compared to the week before to close at 2,635 points – which is below the bull line at 2,650 points.
As such, is the bull dead after just 2 short weeks (after it emerged)? In my personal opinion, movements this week is crucial – should the STI closes above 2,650 points this coming Friday, then in my opinion, the bull is still in-tact; on the other hand, should the STI continue to close below 2,650 points on Friday, then we can say that we are into another bear run once again.
That said, how will the STI likely move in the week ahead? Let us look at its weekly movements below:
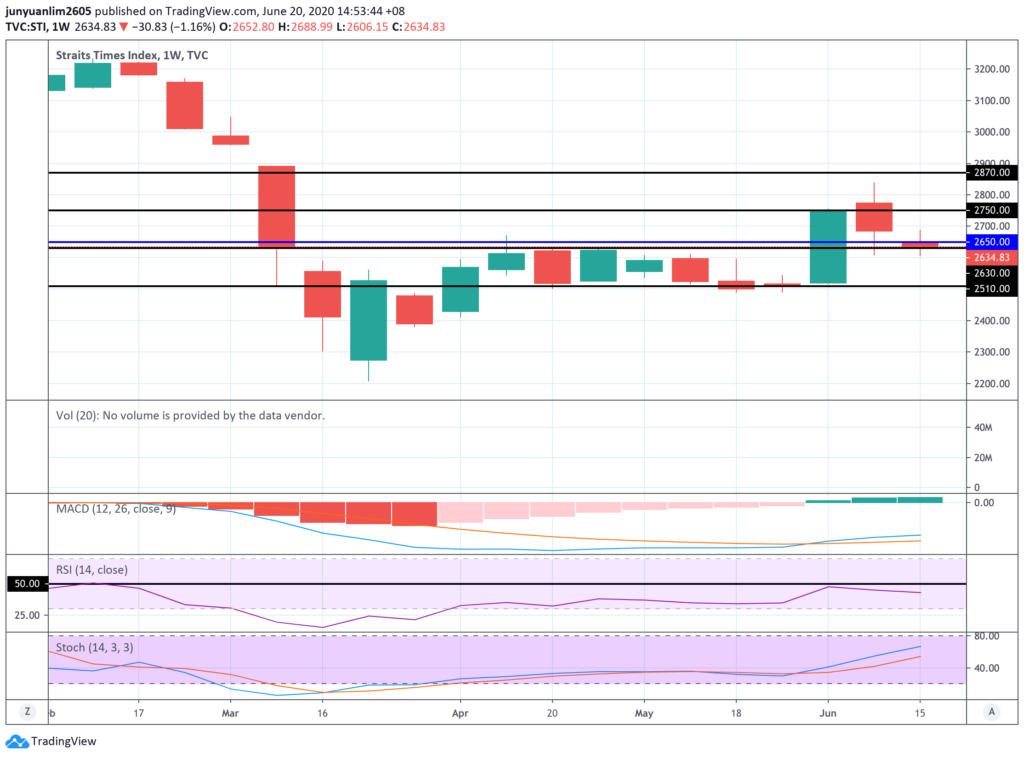
Both MACD and stochastic are in an uptrend position, and the candlestick pattern last week was a doji (suggesting an indecision in the direction of how the index may move.) My personal opinion is that, in the week ahead, barring unforeseen scenarios, the STI is likely to attempt to once again climb back above 2,650.
Now, let us take a look at the weekly share price movements of all 30 blue chip companies in the STI, along with my technical analysis of how their share prices may move in the coming week ahead (do note that what you are going to read below is for educational purposes only, and they do not constitute any buy/sell calls):
1. Ascendas REIT (SGX:A17U)
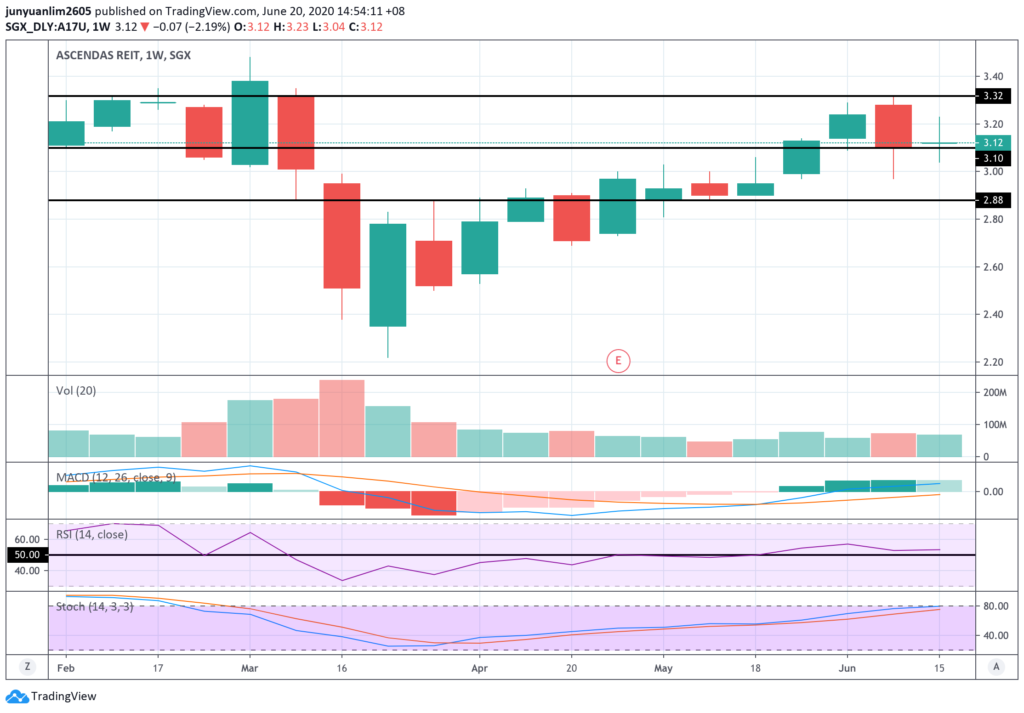
Last week’s unit price movement of Ascendas REIT formed a doji, suggesting an indecision on the direction of the REIT’s unit price movement.
While MACD, RSI, and stochastic are all in an uptrend position, but do take note that stochastic is nearing 80.0, suggesting that further upside may be limited.
In my opinion, the REIT’s unit price may either move up to the resistance line at S$3.32 (and its unit price could peak around this price point in my opinion), or break down the support line at S$3.10.
2. CapitaLand (SGX:C31)
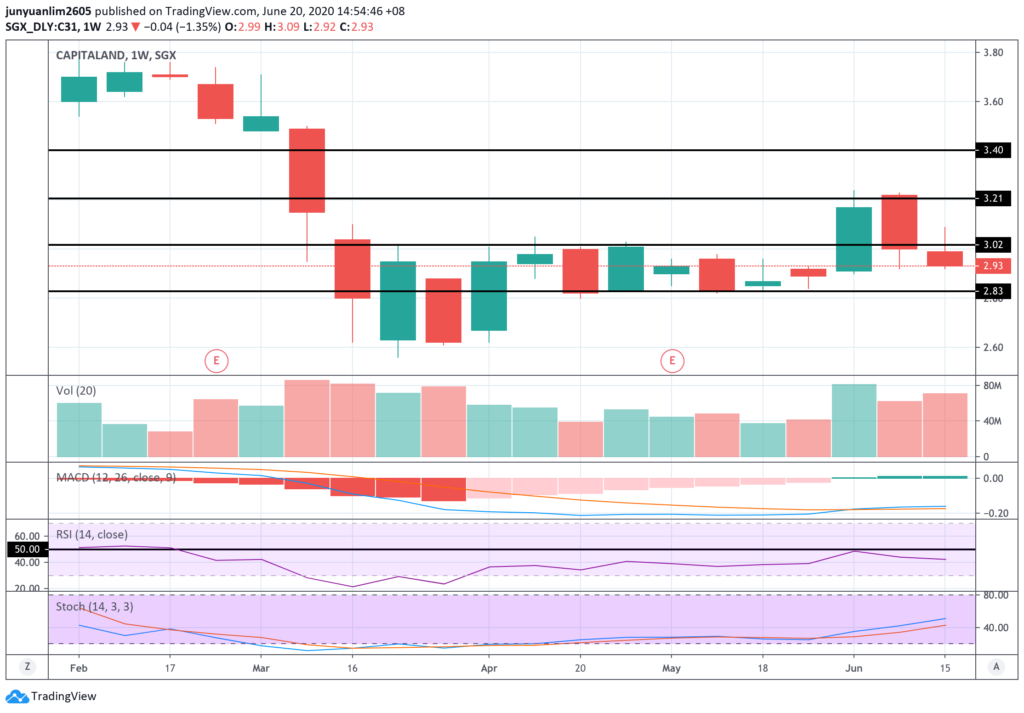
The share price of CapitaLand continued its downward slide last week, where it lost another 7.0 cents, or 2.33% to close at S$2.93.
In terms of trading volume, it is higher compared the previous week, even though MACD and stochastic are both in an uptrend position. As such, in the week ahead, should the share price be able to once again break above the S$3.02 resistance line on a high volume, then it is likely to move higher from there; otherwise, its share price could continue its downward fall towards the S$2.83 support line.
3. CapitaLand Commercial Trust (SGX:C61U)
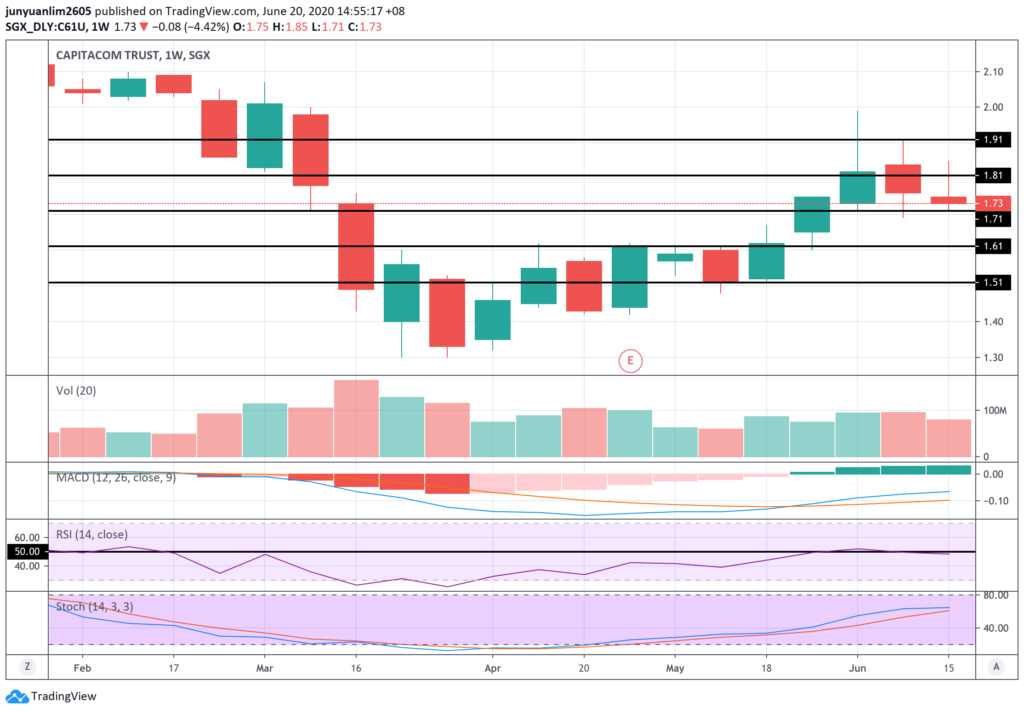
CapitaLand Commercial Trust’s unit price continued its downward fall last week, where it closed to S$1.73 last Friday, 2-cents away from the S$1.71 support line.
While MACD is still in an uptrend, RSI have reversed into a downtrend (where it fell under 50.0), and stochastic looks like its about to reverse into a downtrend as well.
As such, I am of the opinion that it is highly likely that the REIT’s share price is going to continue move around the S$1.71 support line in the week ahead – if it falls below this line on a high volume, then its unit price could head down towards the next support line at S$1.61.
4. CapitaLand Mall Trust (SGX:C38U)

The unit price of the retail REIT fell under the S$2.07 support line last week to close at S$2.03. In terms of trading volume, it is slightly lower compared to the week before, plus the fact the both the MACD and stochastic are still in an uptrend position, it is likely that the retail REIT’s unit price may bounce up again in the week ahead.
Should the REIT’s unit price be above to break above the S$2.07 support-turned-resistance line on a high volume, then it could go up further towards the next resistance line at S$2.18.
5. City Developments (SGX:C09)
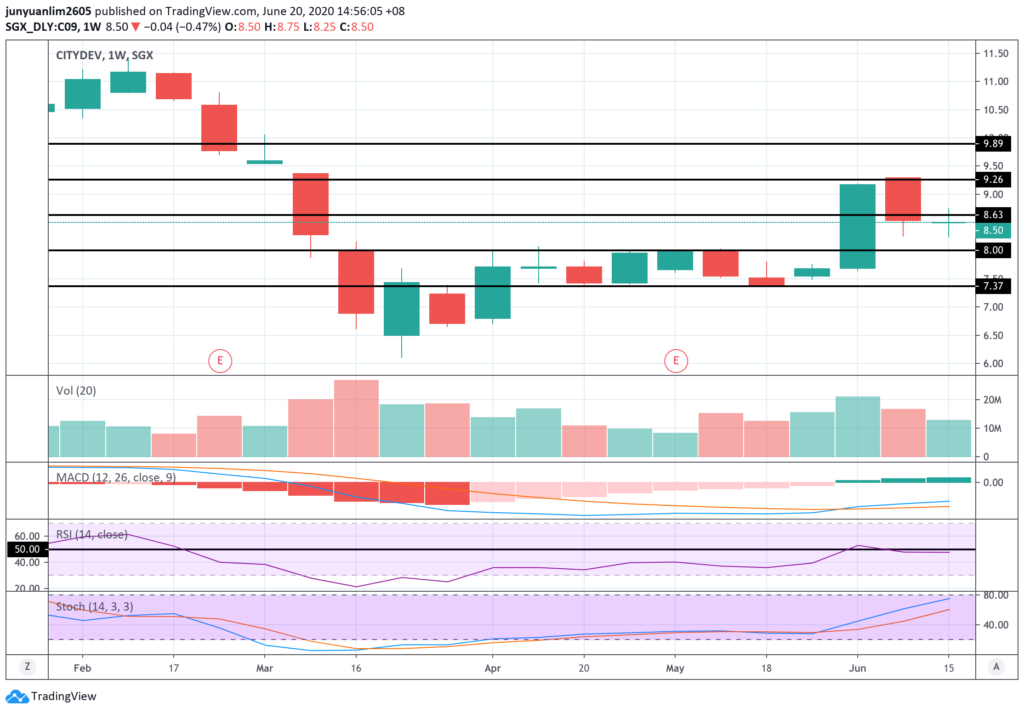
The candlestick pattern that formed last week was a doji, suggesting an indecision in the direction of the conglomerate’s share price movement, even though both the MACD and stochastic are still in an uptrend position.
In my personal opinion, if the share price is able to break above the S$8.63 resistance line on a high volume in the week ahead, then it could possibly move higher from there; otherwise, it is possible that the share price could move towards the S$8.00 support line.
6. ComfortDelGro (SGX:C52)
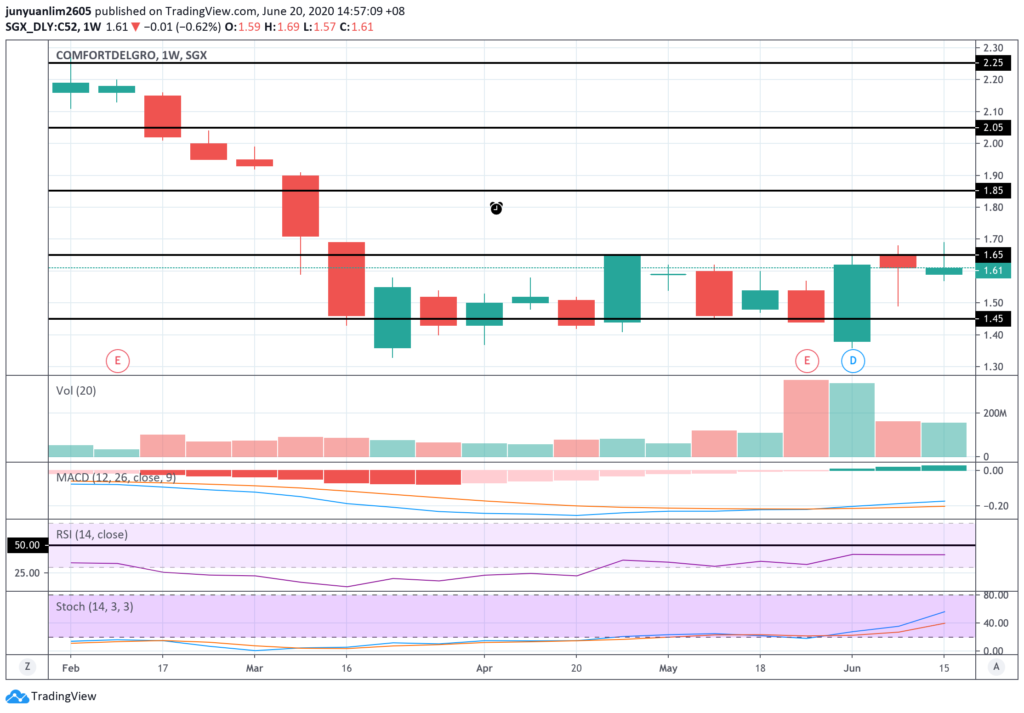
Looking at ComfortDelGro’s share price movements over the past 2 weeks, it seems that there is a rejection of higher prices above the S$1.65 resistance line.
As MACD and stochastic are still in an uptrend position, I am of the opinion that the company’s share price could once again attempt to break the S$1.65 resistance line and move higher from there in the week ahead.
7. Dairy Farm International (SGX:D01)
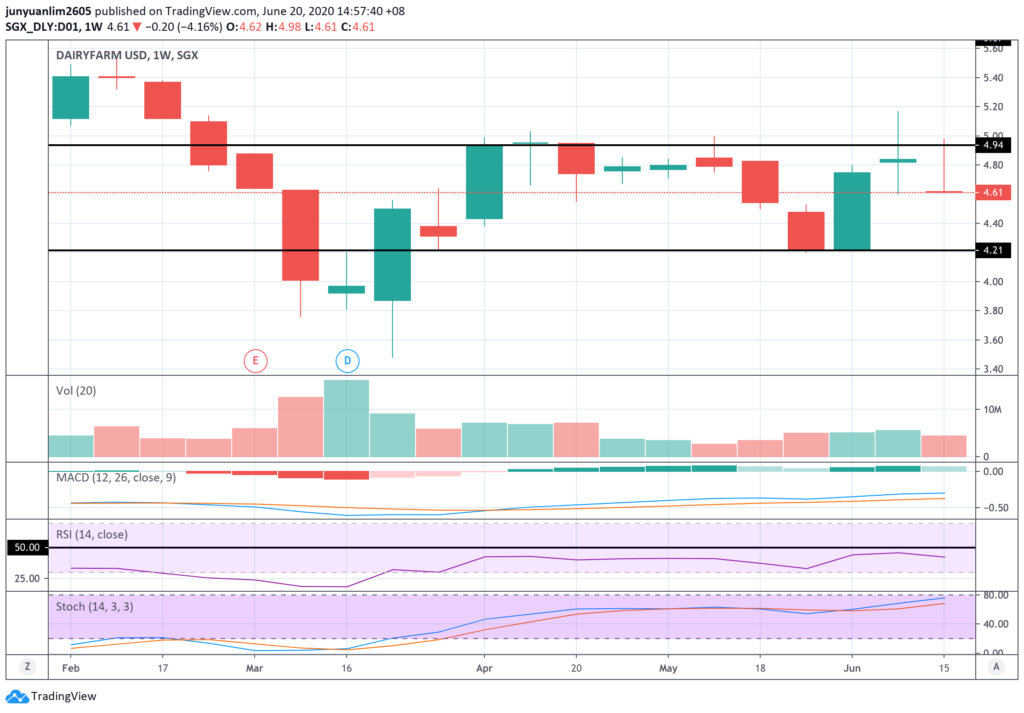
Dairy Farm International’s share price fell back after breaking the US$4.94 resistance line during the week and closed at US$4.61, down by 23.0 US cents, or 4.75% compared to the week before.
While both MACD and stochastic are still in an uptrend, but the latter is nearing the 80.0 mark, which suggests that further upside may be limited (with that, and also looking at its share price movements over the past weeks, it seems to me that the peak is around the US$4.94 level.)
As such, my take on the share price movement of the company in the week ahead is that, it is likely to continue to move within the range of between US$4.21 (where the support line is) and US$4.94 (where the resistance line is.)
8. DBS (SGX:D05)
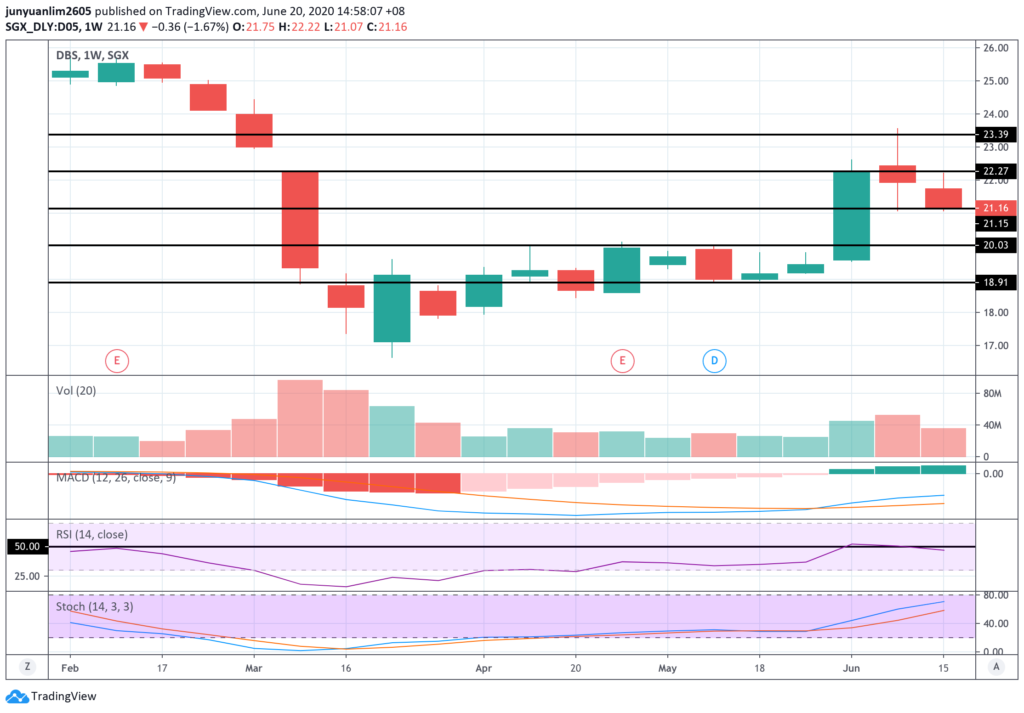
Last week, DBS’ share price moved between the range of S$21.15 (where the support line is) and S$22.27 (where the resistance line is.)
MACD and stochastic are still in an uptrend, but RSI have fell under the 50.0 line, suggesting a downtrend. As such, in the week ahead, I am of the opinion that the Singapore bank’s share price is likely to continue to move within the range of S$21.15 and S$22.27.
9. Genting Singapore (SGX:G13)
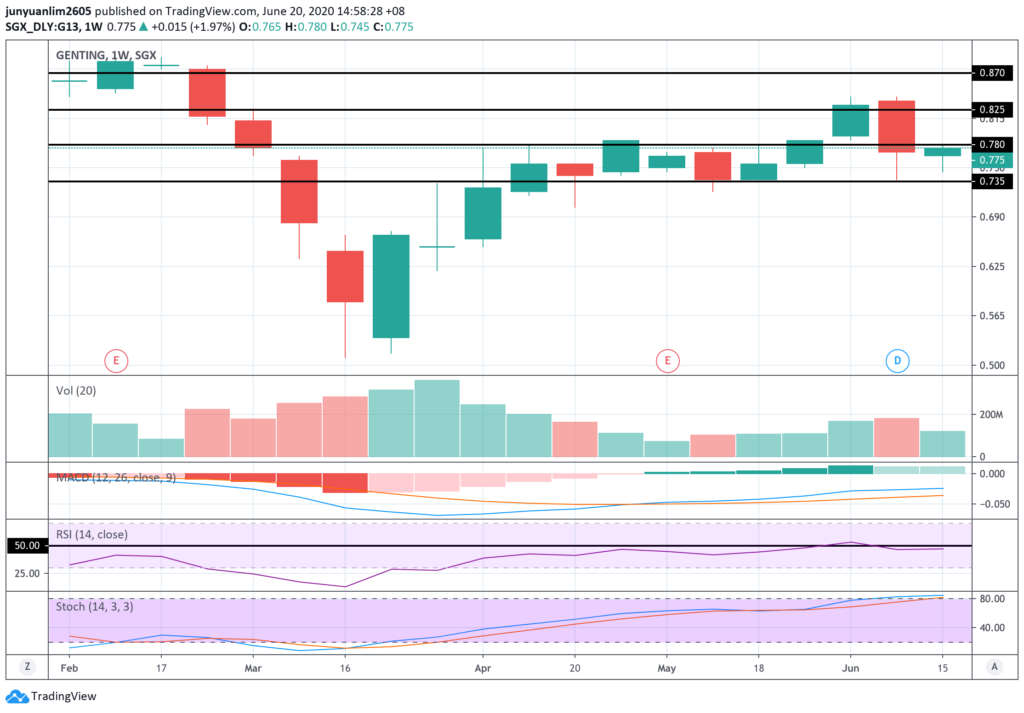
Genting Singapore’s share price ended the week last Friday (19 June) at S$0.775, just half a cent away from the S$0.780 resistance line.
While MACD is still in an uptrend, stochastic have gone beyond 80.0, which suggests that further upside could be limited (and my feel is that the peak of Genting Singapore’s share price in the near-term is around S$0.780.)
In the week ahead, my opinion is that the company’s share price is likely to continue to move within the support line (at S$0.735) and resistance line (at S$0.780.)
10. Hongkong Land (SGX:H78)
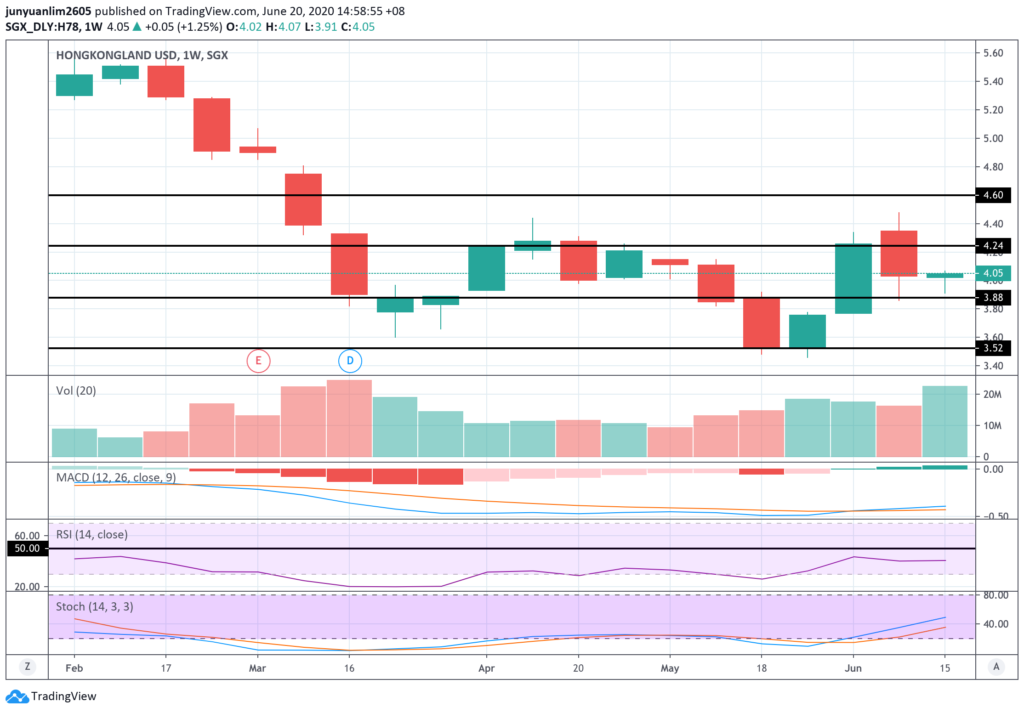
Hongkong Land’s share price recovered slightly last week (by 2.0 US cents, or +0.50%) to close at US$4.05 last Friday. Also, compared to the week before, trading volume is also much higher.
Coupled with the fast that both the MACD and stochastic are also in an uptrend, it is highly likely that Hongkong Land’s share price may continue its upward movement in the week ahead – towards the US$4.24 resistance line.
11. Jardine Cycle & Carriage (SGX:C07)
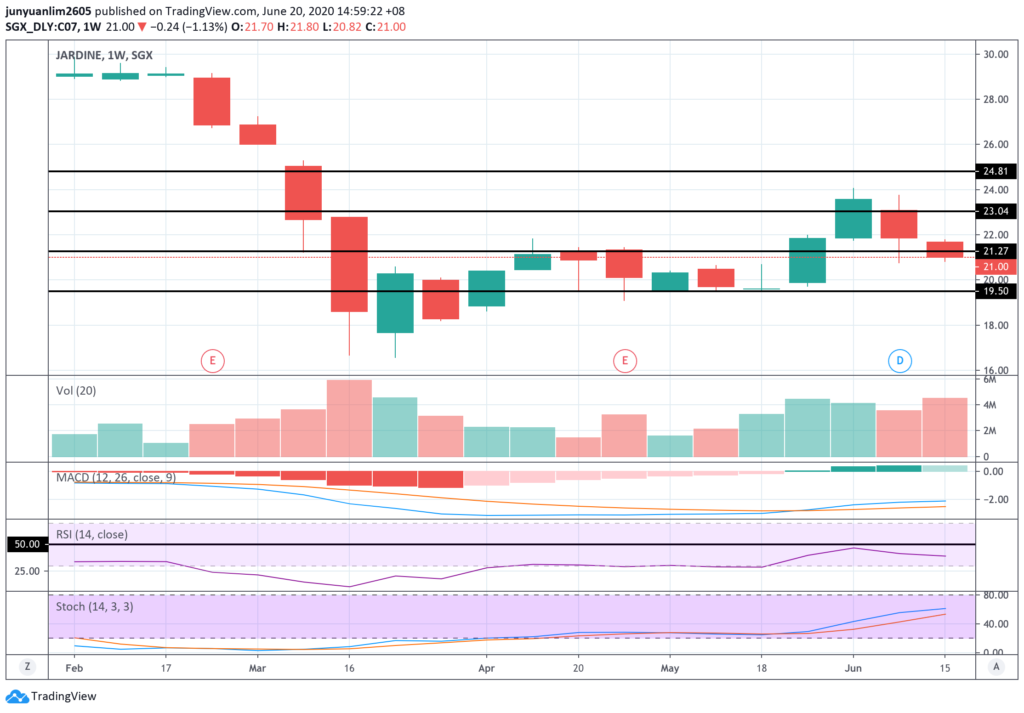
Jardine Cycle & Carriage’s share price continued its downward fall last week, where it fell under the S$21.27 support line to close at S$21.00.
In terms of its trading volume, it was also higher compared to the week before, suggesting that its share price could continue to weaken in the week ahead – down towards the S$19.50 support line.
12. Jardine Matheson (SGX:J36)
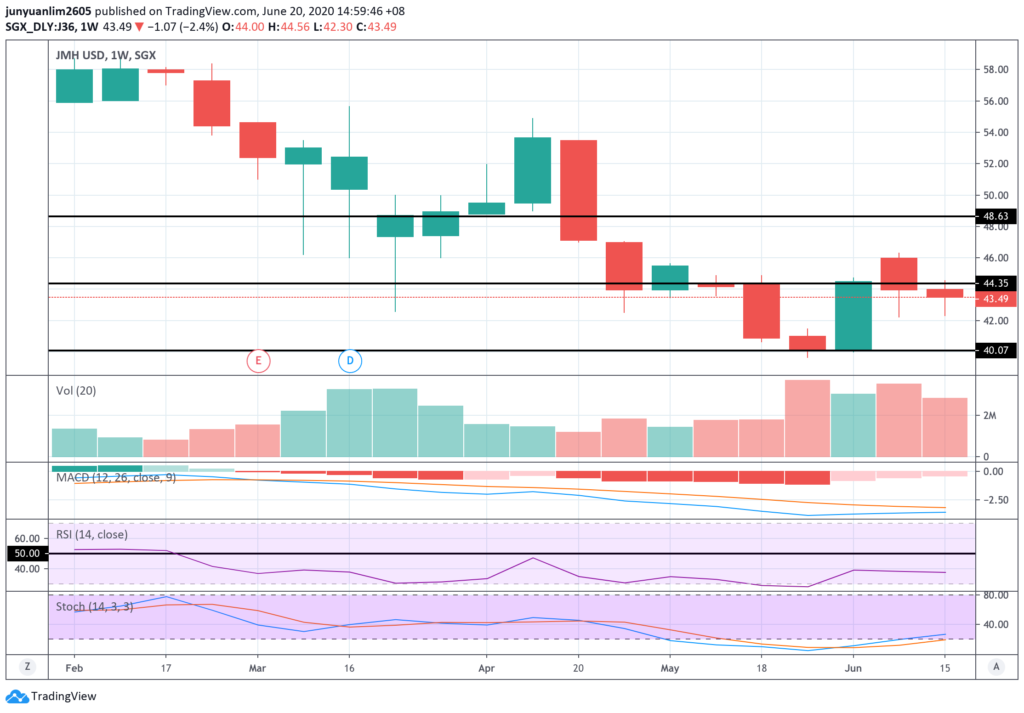
While Jardine Matheson’s share price continued to fall last week (where it went down by 47.0 US cents, or 1.07% compared to last week to close at US$43.49), its trading volume was slightly lower compared to the week before.
In the week ahead, I am of the opinion that if the share price of the conglomerate is able to break above US$44.35 resistance line on a high volume, then it is likely to trend higher from there; otherwise, it may continue its drop towards the US$40.07 support line.
13. Jardine Strategic (SGX:J37)
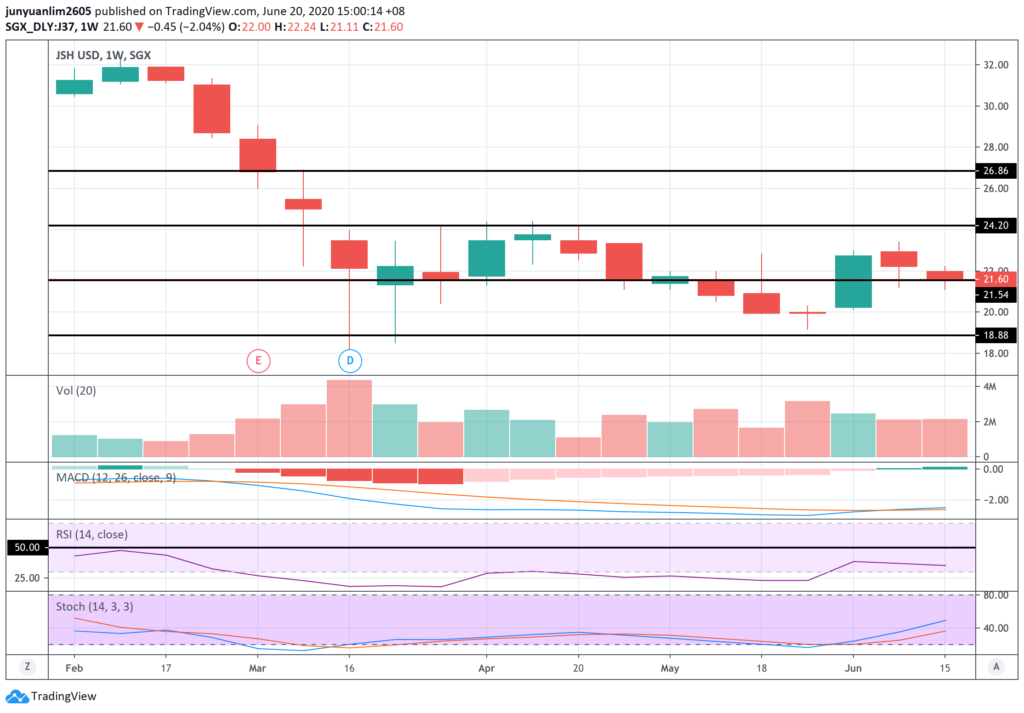
Just like Jardine Matheson, the share price of Jardine Strategic continued to fall for 2 weeks in a row – in the most recent week ended last Friday, its share price fell by 61.0 US cents, or 2.75%, to close at US$21.60 – just a whisker away from the US$21.54 support line. The candlestick pattern that formed was a doji, suggesting an indecision in the conglomerate’s share price movements.
As such, I am of the opinion that its share price could either go up towards the US$24.20 resistance line, or break under the US$21.54 support line in the week ahead.
14. Keppel Corporation (SGX:BN4)
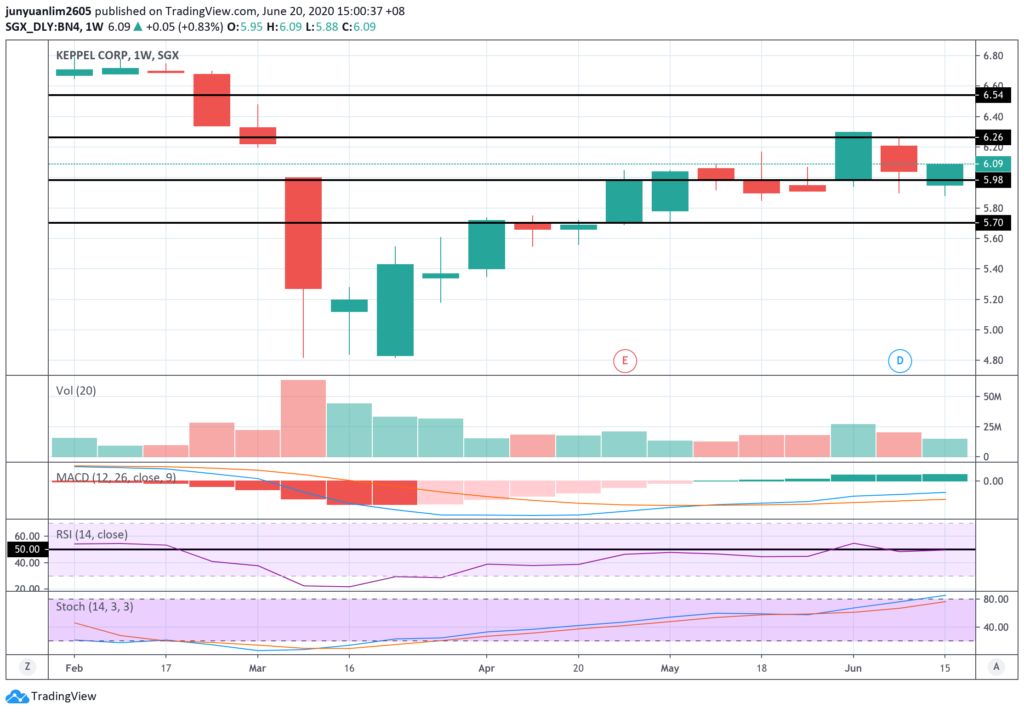
The share price of Keppel Corporation bounced back up after falling under S$5.98 support line during the week to close at S$6.09 last Friday.
While MACD is still in an uptrend, but stochastic is around the 80.0 level, suggesting that further upside to the conglomerate’s share price could be limited (I feel that the peak in the near-term is around the resistance line at S$6.26.)
In the week ahead, I am of the opinion that the company’s share price will largely move between the support (at S$5.98) and resistance (at S$6.26) lines.
15. Mapletree Commercial Trust (SGX:N2IU)
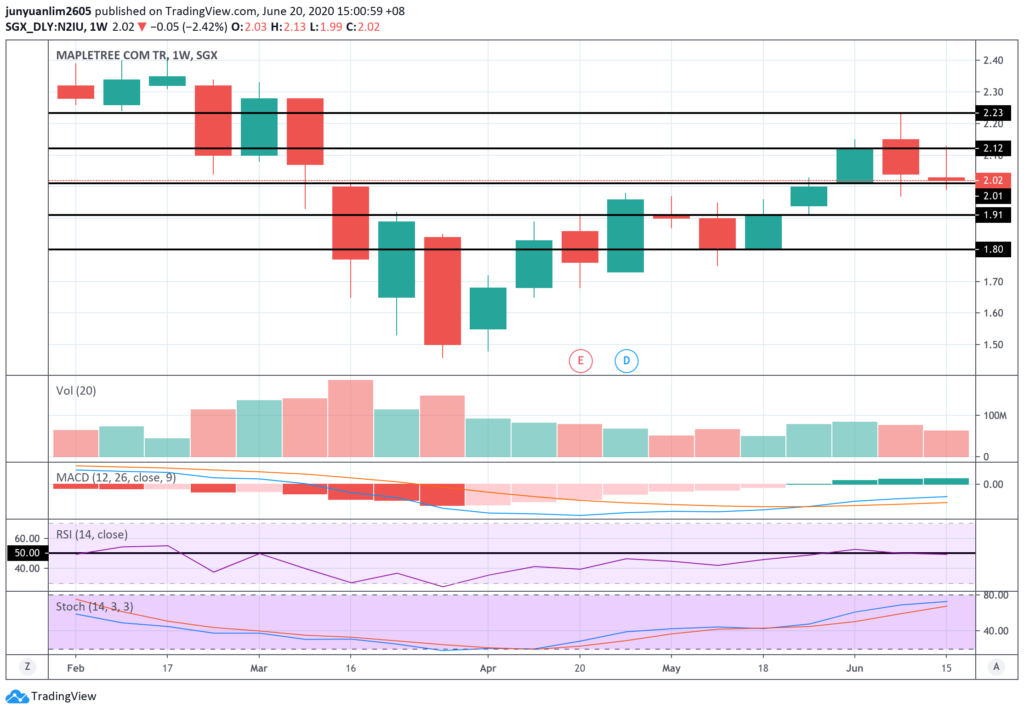
For the second consecutive week, Mapletree Commercial Trust’s unit price closed lower – when trading for the week ended last Friday, its unit price was at S$2.02, just one-cent away from the support line at S$2.01.
While both MACD and stochastic are in an uptrend, its RSI have fell under 50.0, indicating a downtrend. As such, in the week ahead, I am of the opinion that the REIT’s unit price is likely to move within the support (at S$2.01) and resistance (at S$2.12) lines.
16. Mapletree Industrial Trust (SGX:ME8U)
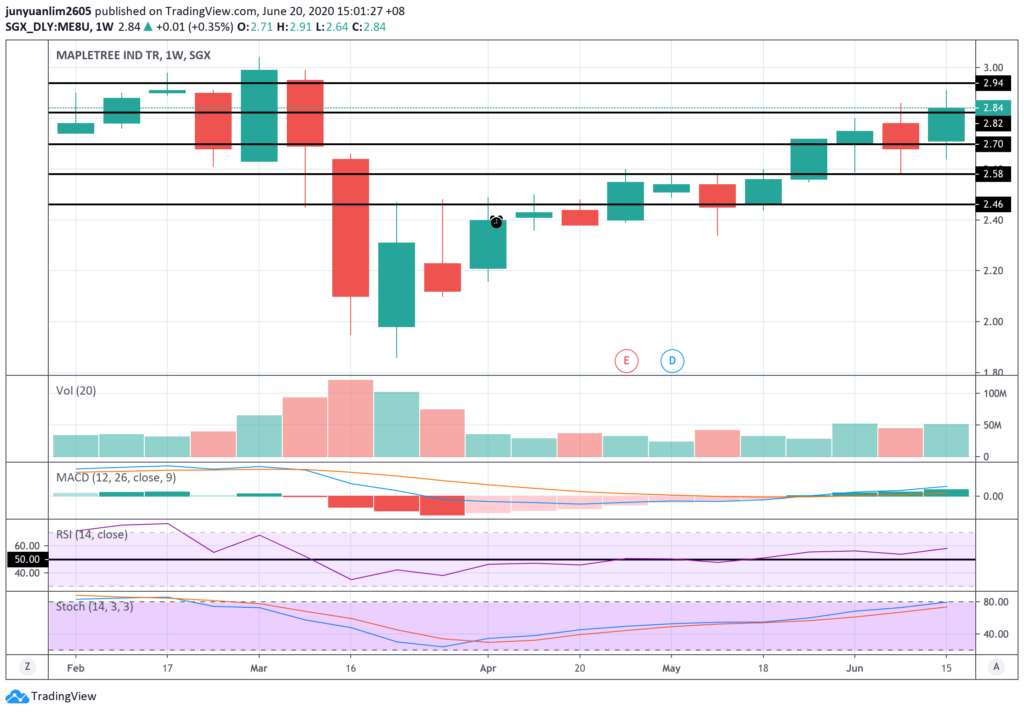
Starting this week, Mapletree Industrial Trust becomes a constituent of the STI (in place of SPH.)
Last week, the REIT’s unit price went up by 16.0 cents, or 5.97% compared to last week, to close at S$2.84 (it also broke above the S$2.82 resistance line.)
In terms of its trading volume, it is also slightly higher compared to the week before, with MACD and RSI also in an uptrend position. However, its stochastic is inching towards 80.0, suggesting that further upside to the REIT’s unit price could be limited.
While I feel that the REIT’s unit price could further move up in the week ahead, but it could peak at around the S$2.94 resistance line.
17. Mapletree Logistics Trust (SGX:M44U)
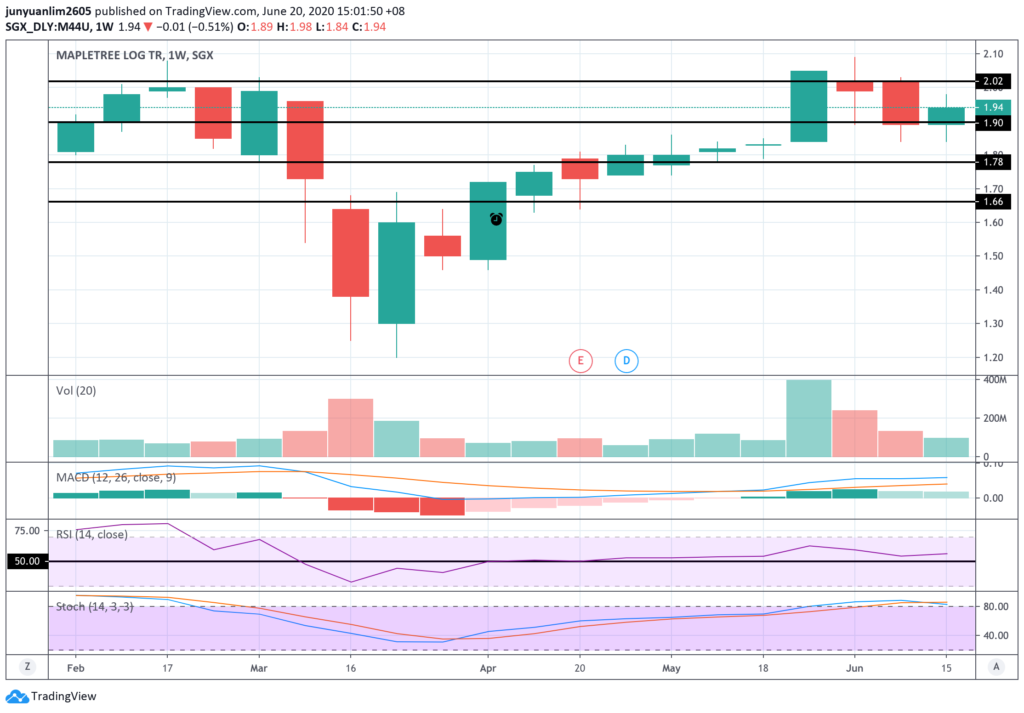
The unit price of the logistics REIT bounced back up after falling slightly under the S$1.90 support line the week before to close at S$1.94 last Friday.
The candlestick pattern, however, was a doji, suggesting an indecision in the direction of the REIT’s unit price movements. Looking at the stochastic, it has turned into a downtrend, suggesting that it is very likely that the unit price have peaked at around this price point and may be heading downwards.
As such, in the week ahead, I feel that its unit price could once again retest the S$1.90 support line and, if it breaks under this price point on a high volume, the REIT’s unit price could further reverse down towards the next support line at S$1.78.
18. OCBC (SGX:O39)
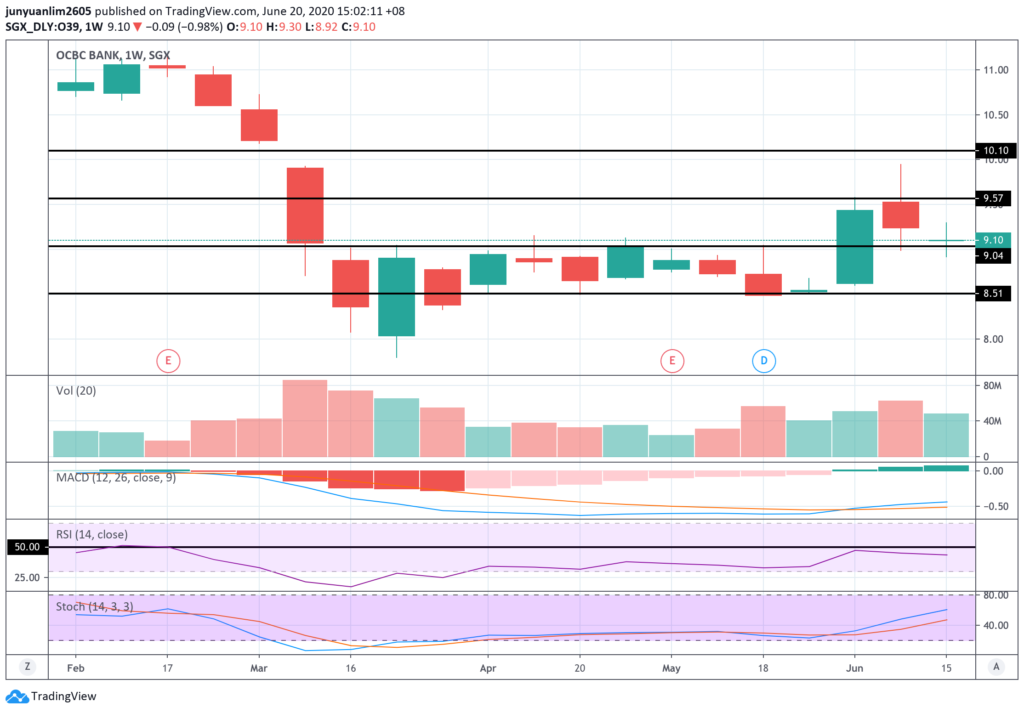
The candlestick pattern for OCBC’s share price movement last week was a doji, suggesting an indecision in the direction of the Singapore bank’s share price movement, even though both the MACD and stochastic are in an uptrend position.
Personally, I feel that the Singapore bank’s share price could move in a range of between S$9.04 (where the support line is) and S$9.57 (where the resistance line is.)
19. SATS (SGX:S58)
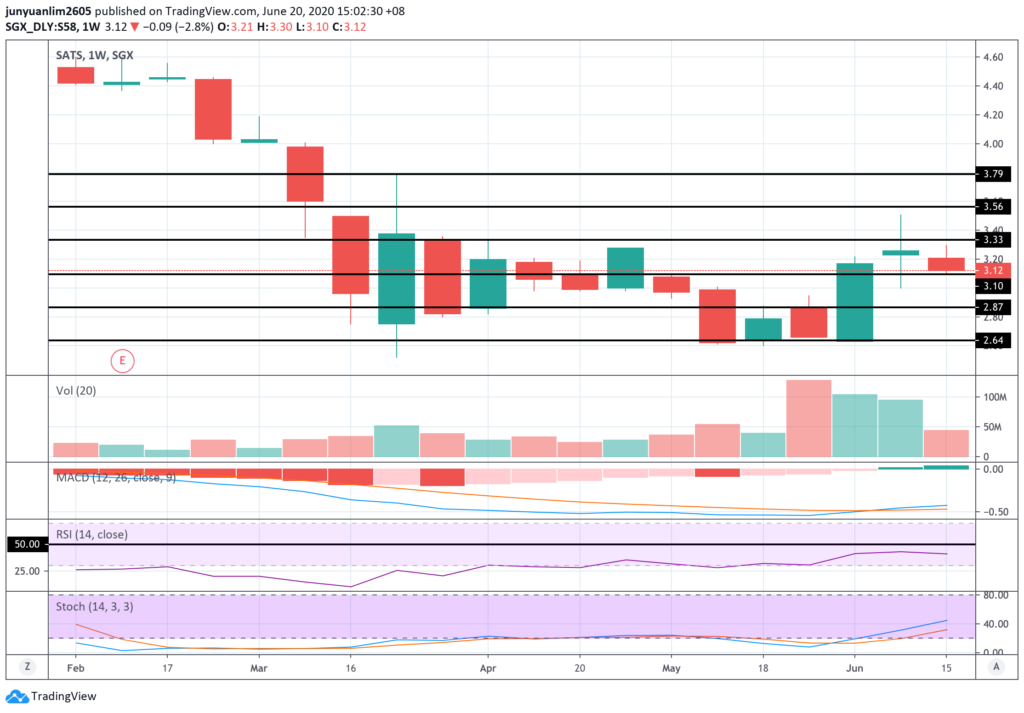
SATS’ share price moved within the range of S$3.10 support line and S$3.33 resistance line last week.
While the company’s share price closed lower compared to the week before (down 14.0 cents, or 4.29% to close at S$3.12), but in terms of trading volume, it is much lower compared to the week before.
Coupled with the fact that both the MACD and stochastic are in an uptrend position, I am of the opinion that the company’s share price could resume its climb in the week ahead (up towards the S$3.33 resistance line.)
20. Sembcorp Industries (SGX:U96)
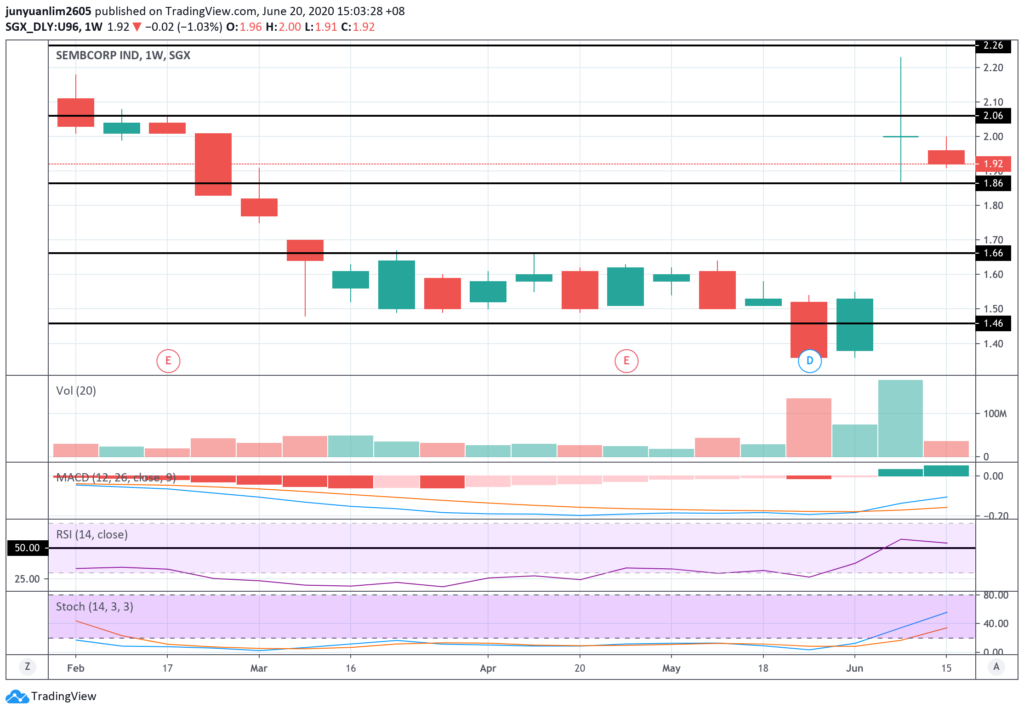
Sembcorp Industries’ share price fell by 8.0 cents, or 4.0% compared to the week before to close at S$1.92 last Friday.
However, in terms of trading volume, it is significantly lower compared to the week before, plus the fact that both the MACD and stochastic are in an uptrend position, it is highly likely that in the week ahead, its share price may continue to climb towards the S$2.06 resistance line.
21. SGX (SGX:S68)
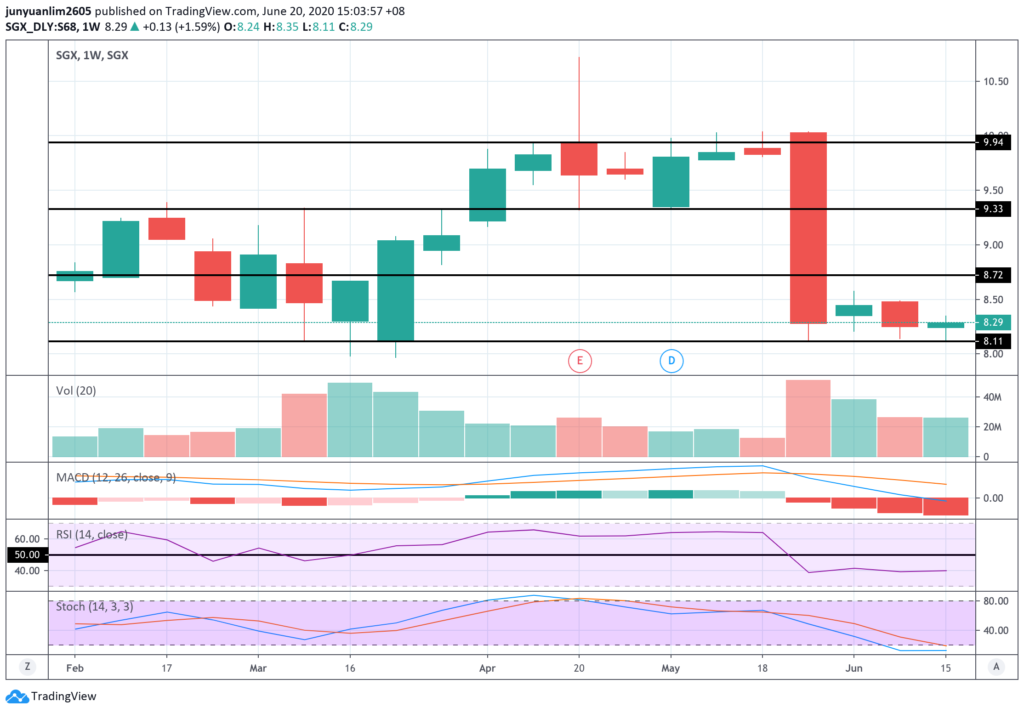
SGX’s share price bounced back up after dropping to S$8.11 to close at S$8.29. The candlestick pattern formed is a doji, suggesting an indecision in the direction of the stock exchange’s share price movements.
While MACD is still deep in a downtrend position, but looking at the stochastic, it seems that the bottom is around the S$8.11 support line and the share price is about to bounce back up from there.
In the week ahead, I am of the opinion that the company’s share price will largely move between the support line (at S$8.11) and resistance line (at S$8.72.)
22. SIA (SGX:C6L)

The share price of Singapore’s national carrier lost further ground last week, where it fell by another 16.0 cents, or 3.85% compared to the week before to close at S$4.00. However, in terms of trading volume, it is much lower compared to the week before. At the same time, both the MACD and stochastic are in an uptrend position.
As such, I am of the opinion that the company’s share price will continue to move within the support (at S$3.82) and resistance (at S$4.33) lines in the week ahead.
23. SingTel (SGX:Z74)
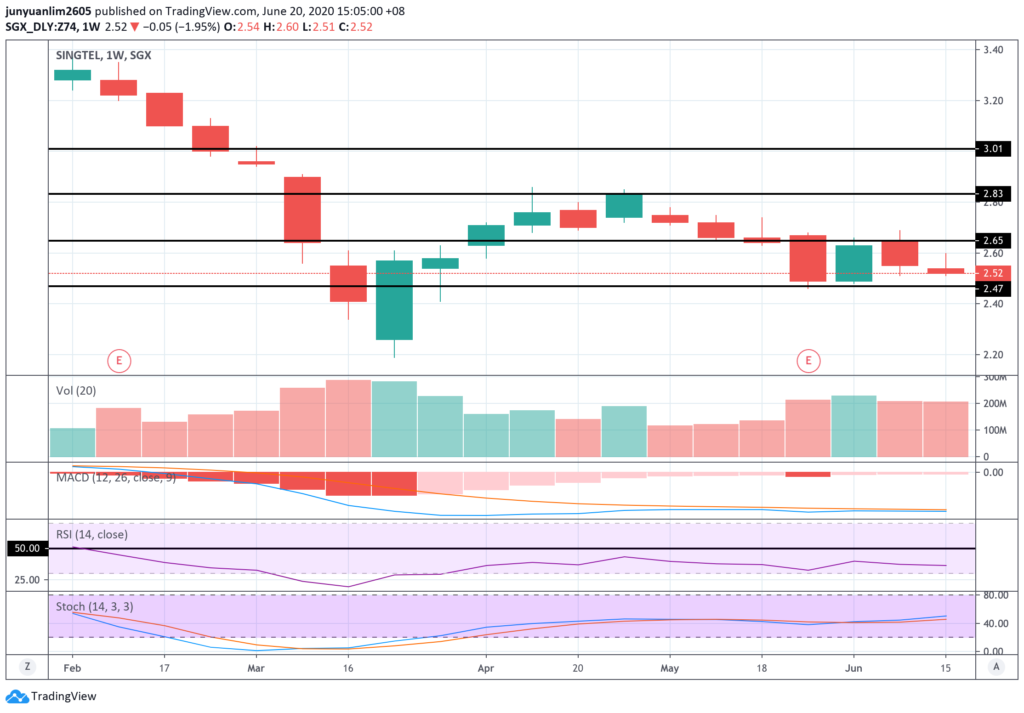
SingTel’s share price fell by 3.0 cents, or 1.18% compared to the week before to close at S$2.52 last Friday.
In terms of its trading volume, it is pretty much the same compared to the week before. Both the MACD and RSI is still in a downtrend position, while stochastic is in an uptrend position.
Just like how its share price have been moving in a range between S$2.47 and S$2.65 over the past 4 weeks (including the week that just passed), I personally feel that the telecommunications company’s share price will continue to move in this range in the week ahead.
24. ST Engineering (SGX:S63)
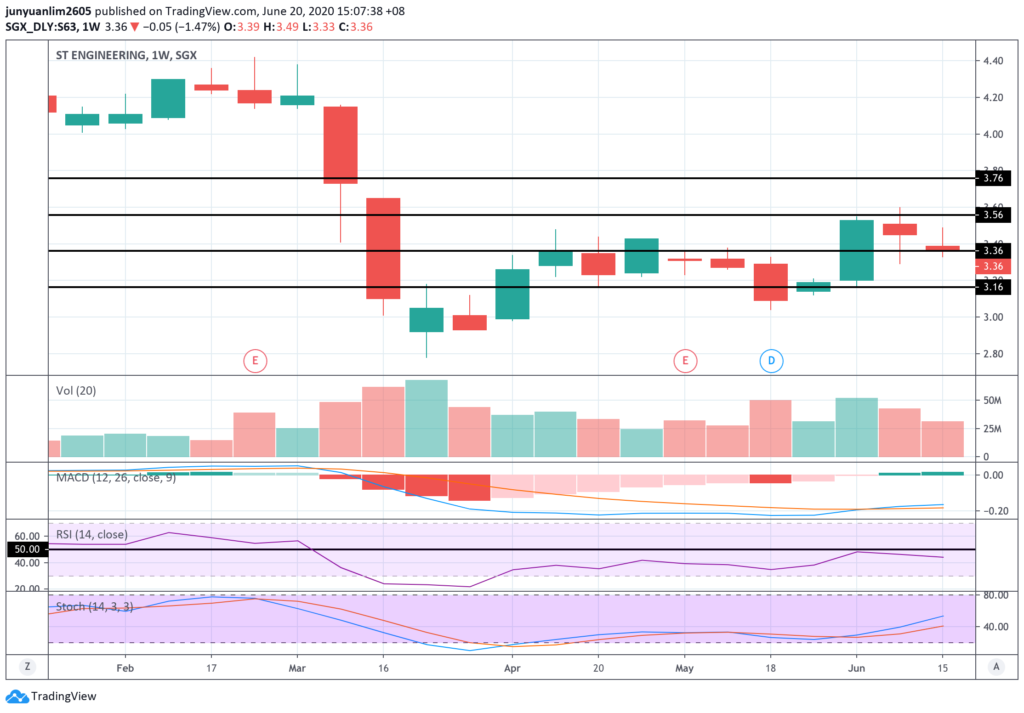
ST Engineering’s share price ended the week last Friday at S$3.36, where the support line is. Compared to the week before, its share price 9.0 cents, or 2.61%.
However, as the trading volume last week was lower compared to the week before, coupled with the fact that both MACD and stochastic are in an uptrend position, I am of the view that in the week ahead, the company’s share price may bounce up from the support line (at S$3.36.)
25. ThaiBev (SGX:Y92)
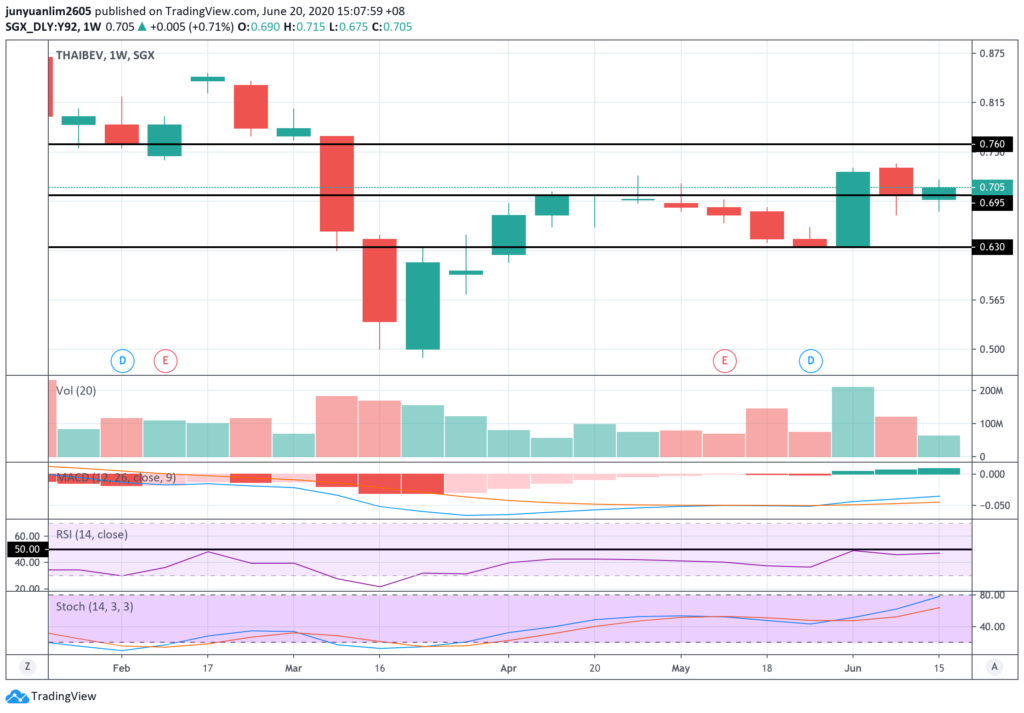
ThaiBev’s share price rebounded after falling under the S$0.695 support line during the week to close at S$0.705.
While MACD is in an uptrend, but stochastic is inching up to 80.0, implying that further upside to the company’s share price may be limited. Also, looking at the candlestick pattern, it is a doji, suggesting an indecision in the direction of the company’s share price.
As such, I am of the opinion that the company’s share price will continue to hoover around the S$0.695 support line – if it drops below this line on a high volume, then its share price could reverse down towards the next support line at S$0.630.
26. UOB (SGX:U11)
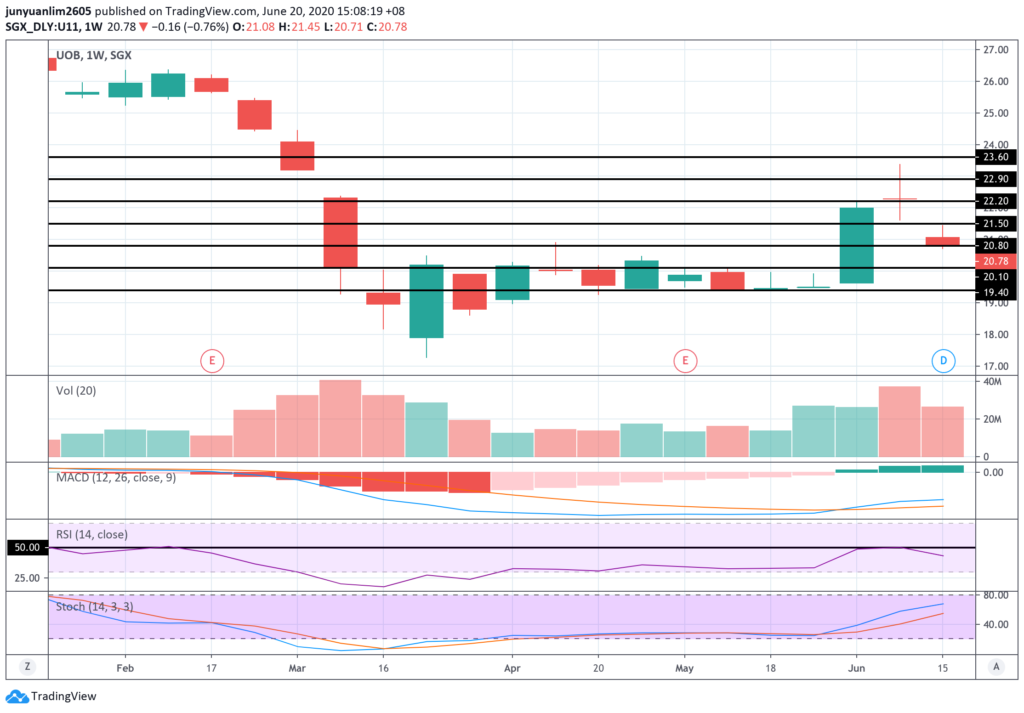
Due to the Singapore bank going ex-dividend on 15 June for a final dividend payout (declared when the bank released its fourth quarter and full-year results for financial year 2019) of 0.75 cents/share, UOB’s share price closed at S$20.78 (2 cents under the support line at S$20.80) last Friday (down by $1.50, or 6.73% compared the week before.)
Its MACD and stochastic are in an uptrend position. As such, in the week ahead, if the bank’s share price could once again break past the support-turned-resistance line at S$20.80 on a high volume, then it could possibly trend higher towards the next resistance line at S$21.50.
27. UOL (SGX:U14)
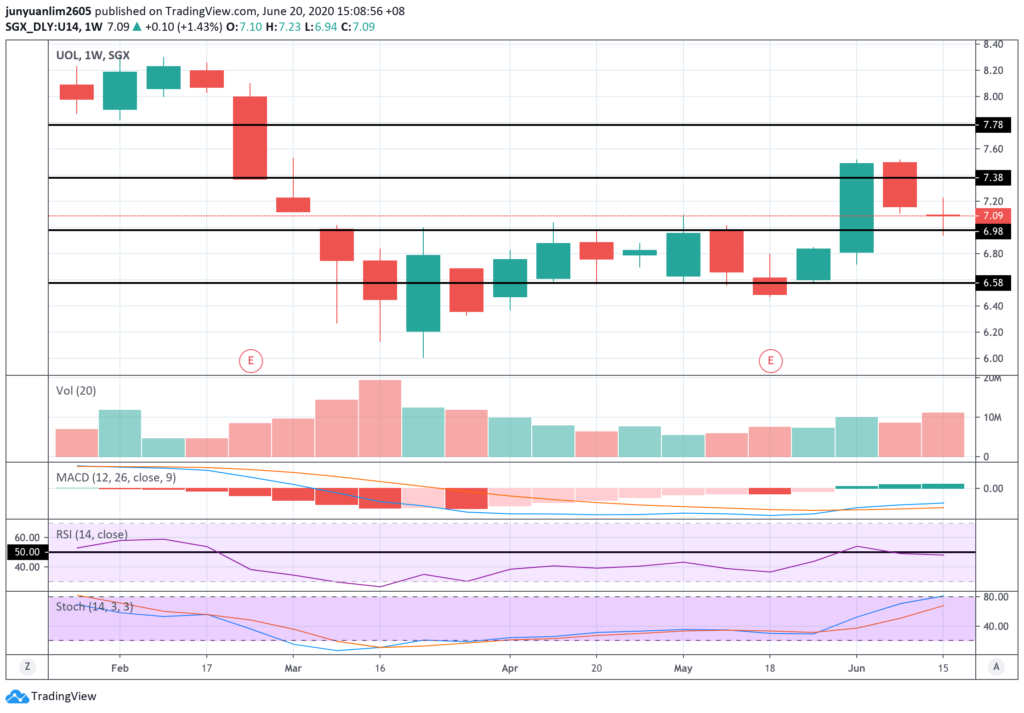
The candlestick pattern for UOL’s share price movement last week was a doji, suggesting an indecision in the direction of the company’s share price movements.
While MACD is still in an uptrend position, but in terms of stochastic, it is at the 80.0 mark, which indicates that further upside could be limited.
Taking all the above into consideration, I am of the opinion that its share price could move in either direction in the week ahead – either up towards the S$7.38 resistance line (where the share price of the company could peak at around this price point), or breaking down the S$6.98 support line and trend downwards.
28. Venture Corporation (SGX:V03)
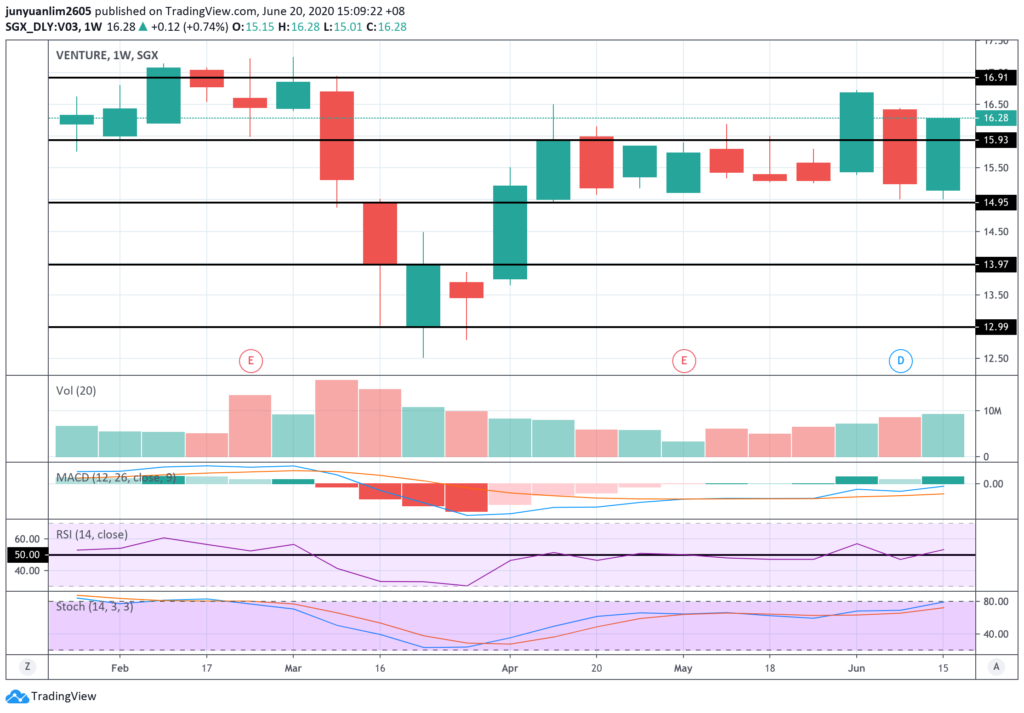
The share price of Venture Corporation rebounded last week, where it broke above the S$15.93 resistance line once again to close at S$16.28 – not just that, the trading volume was also slightly higher compared to the week before.
While MACD is still in an uptrend position, but stochastic is around the 80.0 point, which indicates that further upside may be limited.
In the week ahead, it is possible that the company’s share price may continue its upward movement, but in my opinion, it could peak somewhere around the S$16.91 resistance line.
29. Wilmar International (SGX:F34)

Wilmar’s share price fell by 14.0 cents, or 3.54% compared to the week before, to close at S$3.82 – just 3 cents above the S$3.79 support line.
As the trading volume is higher compared to the week before, coupled with the fact that stochastic is about to reverse into a downtrend, I personally feel that the company’s share price is likely to continue to remain weak in the week ahead – if it falls under the S$3.79 support line on a high volume, then it could trend lower towards the next support line at S$3.63.
30. Yangzijiang Shipbuilding (SGX:BS6)
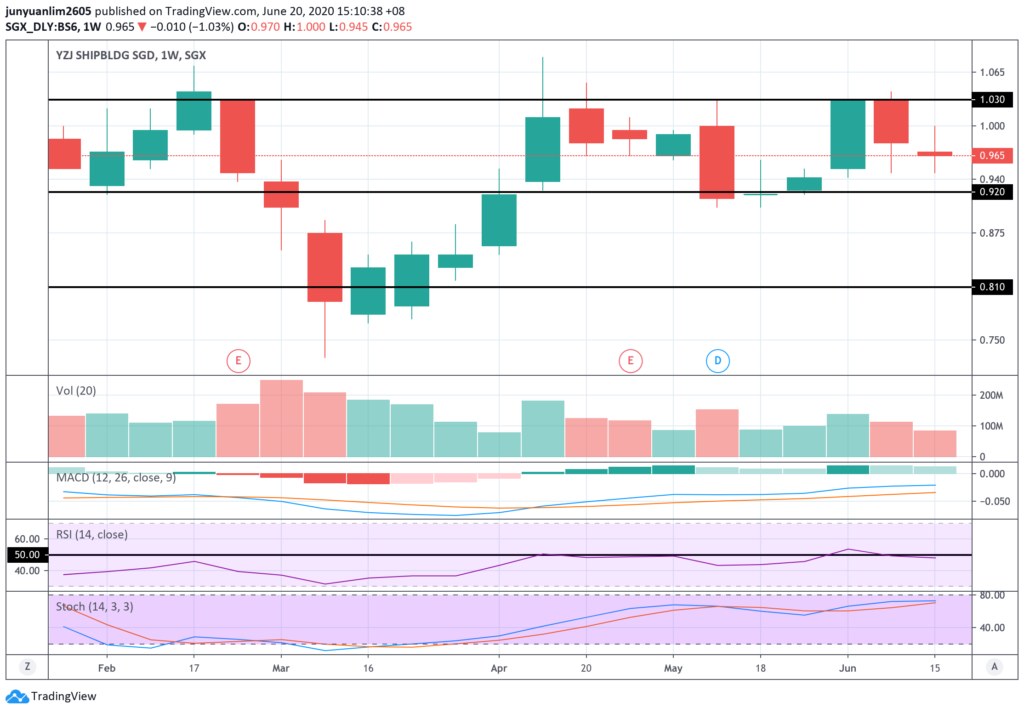
Yangzijiang’s share price fell by 1.5 cents, or 1.53% compared to the week before to close at S$0.965, with the candlestick pattern being a doji – suggesting an indecision on the direction of the company’s share price movement.
Looking at the technical indicators, RSI have dropped below 50.0 (indicating a downtrend), and stochastic is also about to reverse into a downtrend. As such, I am of the opinion that the company’s share price is likely to remain weak in the week ahead – where it could move towards the support line at S$0.920.
Announcement: No Weekly Updates Next Week (29 June 2020)
I will not be posting any weekly technical analysis updates of the STI and its constituents next Monday (29 June 2020) as I will be busy with the compilation of the AGMs of Hong Leong Finance (25 June), CapitaLand Mall Trust (25 June), as well as Ascendas REIT (29 June) – all of which I will be attending (as a shareholder) and providing a summary in due course. I will be posting the next weekly technical analysis update the following Monday (06 July 2020.)
Disclaimer: Please note that the above sharing is for your educational purposes only, and it does not imply any buying/selling calls for any of the companies above. At the time of writing, I am a shareholder of Ascendas REIT, CapitaLand Mall Trust, ComfortDelGro, DBS, Mapletree Commercial Trust, SATS, SIA, SingTel, OCBC, and UOB.
Are You Worried about Not Having Enough Money for Retirement?
You're not alone. According to the OCBC Financial Wellness Index, only 62% of people in their 20s and 56% of people in their 30s are confident that they will have enough money to retire.
But there is still time to take action. One way to ensure that you have a comfortable retirement is to invest in real estate investment trusts (REITs).
In 'Building Your REIT-irement Portfolio' which I've authored, you will learn everything you need to know to build a successful REIT investment portfolio, including a list of 9 things to look at to determine whether a REIT is worthy of your investment, 1 simple method to help you maximise your returns from your REIT investment, 4 signs of 'red flags' to look out for and what you can do as a shareholder, and more!

You can find out more about the book, and grab your copy (ebook or physical book) here...


Comments (0)