Since my initial post where I shared about how one can go about buying/selling in the Hong Kong Stock Exchange (you can read the post here in case you’ve missed it), there are a couple of readers who asked me on the companies I am looking at.
Today, I’d like to share with you all the researches I’ve done about the Hong Kong-listed company Tencent Holdings Limited (SEHK:0700), and I hope you’ll gain a better understanding about the company at the end of it:
About Tencent Holdings Limited:
- An Internet services company established in Shenzhen, Guangdong Province in China in 1998
- Today, Tencent Holdings Limited forms the trio of “BAT” in China – B for Baidu, A for Alibaba, and T for Tencent.
- You may be familiar with some of the names below (all of which are the companies’ consumer businesses):
- WeChat (微信), a multi-purpose messaging, social media, and mobile payment app – first released in 2011, and by 2018, it became one of the world’s largest standalone mobile apps. It is described as one of China’s “super apps” because of its wide range of functions made available to its users.
- Tencent QQ, which offers online social games, music, shopping, microblogging, etc.
- 腾讯视频, or Tencent Video, a Chinese video streaming website.
- QQ音乐 (QQ Music), 酷狗音乐 (KuGou), 酷我音乐盒 (Kuwo)
- If you are a hardcore gamer, then the following names should be immediately recognisable to you – League of Legends (by Riot Games, which is owned by Tencent Games), along with Fortnite (by Epic Games), Assassin’s Creed (by Ubisoft), and Call of Duty (by Actvision Blizzard) – where Tencent has a stake in the 3 companies (Epic Games, Ubisoft, and Actvision Blizzard.)
- Apart from that, the company also provides fintech and cloud services, along with online advertising services for enterprises.
- From the company’s website, I note that its credit ratings were as follows (accurate at the time of writing): A+ with a stable outlook by S&P, A1 with a stable outlook by Moody’s, and A+ with a stable rating by Fitch Ratings.
Historical Performance of the Company:
In this section, you will find some of the key performances of the company over a 5-year period (between FY2015 and FY2019 – the company have a financial year-end on 31 December):
Revenue, and Net Profit Attributable to Shareholders:
| FY 2015 | FY 2016 | FY 2017 | FY 2018 | FY 2019 | |
| Total Revenue (RMB’mil) | RMB 102,863m | RMB 151,938m | RMB 237,760m | RMB 312,694m | RMB 377,289m |
| Net Profit Attributable to Shareholders (RMB’mil) | RMB 28,806m | RMB 41,095m | RM 71,510m | RMB 78,719m | RMB 93,310m |
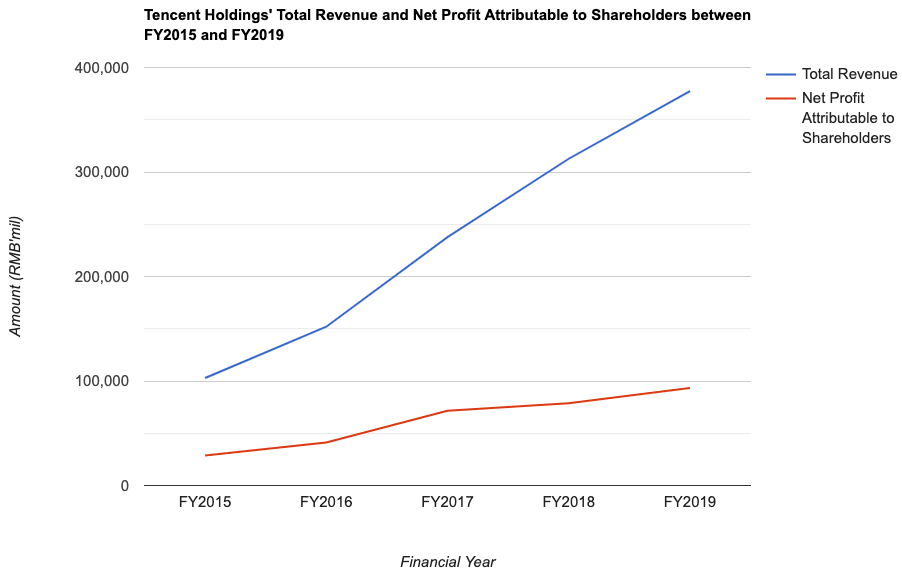
As you can see from the table and line chart above, both the company’s top- and bottom-line have recorded improvements every single year for the past 5 years:
- Revenue have recorded a compound annual growth rate (CAGR) of 29.7% – where it has gone up from RMB102,863m in FY2015 to RMB377,289m in FY2019.
- Net profit attributable to shareholders improved at a CAGR of 26.5% – where it increased from RMB28,806m in FY2015 and RMB93,310m in FY2019.
Gross and Net Profit Margin, and Return on Equity:
| FY 2015 | FY 2016 | FY 2017 | FY 2018 | FY 2019 | |
| Gross Profit Margin (%) | 59.5% | 55.6% | 49.2% | 45.5% | 44.4% |
| Net Profit Margin (%) | 28.0% | 27.0% | 30.0% | 25.2% | 24.7% |
| Return on Equity (%) | 23.6% | 22.1% | 25.8% | 22.1% | 19.1% |
Looking at the years between FY2017 and FY2019, all three of them (gross profit margin, net profit margin, and return on equity) have gone on a downward slide.
My personal opinion for this is because of the competitiveness in technology companies, and this can compress the company’s margins.
Current Ratio:
Does the company have sufficient liquidity to meet its short-term (those within a year) obligations? The way to find out is through what is called the “current ratio”, which can be calculated by dividing the company’s current assets by its current liabilities – and a value under 1.0 means the company may have problems meeting its short-term obligations (not ideal.)
With that, let us take a look at Tencent’s current ratio over the years:
| FY 2015 | FY 2016 | FY 2017 | FY 2018 | FY 2019 | |
| Current Ratio (%) | 1.2 | 1.5 | 1.2 | 1.1 | 1.1 |
Over the past 5 years, Tencent have been maintaining its current ratio at around the range of 1.1 to 1.2.
Net Cash or Net Debt?
| FY 2015 | FY 2016 | FY 2017 | FY 2018 | FY 2019 | |
| Cash and Cash Equivalents as at the End of Period (31 Dec) (RMB’mil) | RMB 43,438m | RMB 71,902m | RMB 105,697m | RMB 97,814m | RMB 132,991m |
| Total Borrowings (RMB’mil) | RMB 24,351m | RMB 69,827m | RMB 97,790m | RMB 114,181m | RMB 126,952m |
| Net Cash/Debt (RMB’mil) | +RMB 19,087m | +RMB 2,075m | +RMB 7,907m | -RMB 16,367m | +RMB 6,039m |
Over the 5 years I have looked at, even though its total borrowings have been on a rise every single year, but the company have remained in a net cash position in a total of 4 out of 5 years (with the exception of FY2018, where it sank into a net debt position.)
Tencent’s Dividend Payouts to Shareholders over the Past 5 Years:
Tencent declares a dividend payout to shareholders on an annual basis (meaning one payout a year), with an ex-dividend date around mid-May.
The following is the company’s dividend payout to shareholders over the years, along with its dividend payout ratio:
| FY 2015 | FY 2016 | FY 2017 | FY 2018 | FY 2019 | |
| Dividend Per Share (HKD) | HKD 0.47 | HKD 0.61 | HKD 0.88 | HKD 1.00 | HKD 1.20 |
| Dividend Payout Ratio (%) | 15.4% | 14.1% | 11.7% | 12.2% | 12.4% |
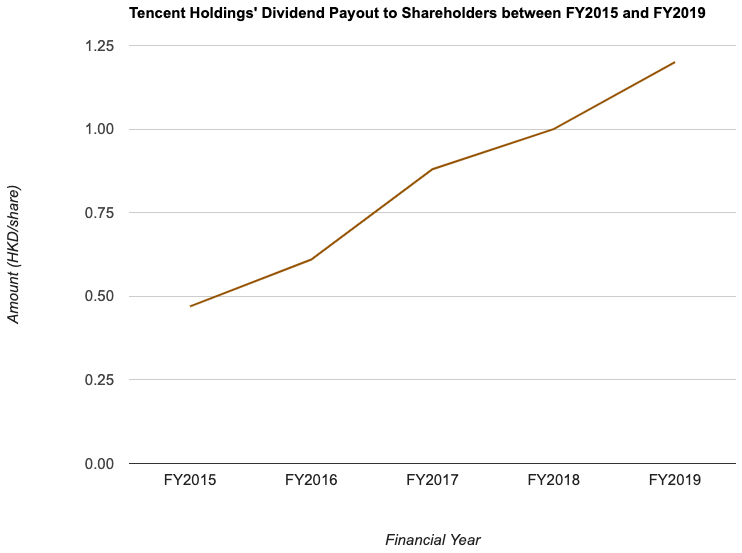
Looking at its dividend per share payout to shareholders over the past 5 years, it has gone up from HKD0.47 in FY2015 to HKD1.20 in FY2019, a CAGR of 20.6%. Also, its dividend payout have also gone up every single year.
However, its low payout ratio suggests that the company have retained a huge portion of its earnings for future growth.
Is Tencent’s Current Share Price Considered Cheap/Expensive?
One of the ways I find out whether or not a company is considered cheap or expensive is by looking at its current valuation (based on its current share price), and compare this with the historical average (which I compute at the backend.)
At the time of writing, Tencent’s share price is trading at HKD440.60. As such, its current valuations is as follows:
P/E ratio: 39.4
P/B ratio: 8.3
Dividend Yield: 0.3% (computed based on the company’s dividend payout of HKD1.20/share in FY2019)
The company’s 5-year historical average valuations (which I have computed) is as follows:
P/E ratio: 38.4
P/B ratio: 9.5
Yield: 0.3%
Looking at its current valuations, and comparing against its 5-year average, at its current share price, Tencent is considered to be neither trading at a discount nor at a premium – due to its lower current P/B ratio (compared to the 5-year average), offset by a higher current P/E ratio (compared to the 5-year average.)
Conclusion:
The writeup is by no means a recommendation to invest or divest in Tencent Holdings Limited. It is just a sharing for you to learn more about the company.
Some of the pluses include its growing top- and bottom-lines over the years (with CAGR of more than 20%), along with a growing dividend payout to shareholders (even though when converted to SGD, it is not much, but it is something.)
On the other hand, the company’s gross and net profit margins have declined over the years.
Disclaimer: At the time of writing, I am not a shareholder of Tencent Holdings Limited.
Are You Worried about Not Having Enough Money for Retirement?
You're not alone. According to the OCBC Financial Wellness Index, only 62% of people in their 20s and 56% of people in their 30s are confident that they will have enough money to retire.
But there is still time to take action. One way to ensure that you have a comfortable retirement is to invest in real estate investment trusts (REITs).
In 'Building Your REIT-irement Portfolio' which I've authored, you will learn everything you need to know to build a successful REIT investment portfolio, including a list of 9 things to look at to determine whether a REIT is worthy of your investment, 1 simple method to help you maximise your returns from your REIT investment, 4 signs of 'red flags' to look out for and what you can do as a shareholder, and more!

You can find out more about the book, and grab your copy (ebook or physical book) here...


Comments (0)