As you may already know, I am currently looking into investing in the Hong Kong stock market. Two days back, I have written a post where I shared what you need to know to buy and sell on the Hong Kong Stock Exchange (HKEX) – if you have missed the post, you can check it out here.
Today, I would like to put the two stock exchanges (Singapore Exchange, or SGX, for Singapore, and The Stock Exchange of Hong Kong, or HKEX, for Hong Kong) side-by-side to find out which stock exchange is more superior in terms of their market capitalisation, historical performances, dividend payout, and also which stock exchange is currently “cheaper” between the two in terms of their current valuations (at the time of writing.)
Let’s begin.
Market Capitalisation:
Based on their share prices at the time of writing (on 04 June 2020), the two stock exchanges’ market capitalisations are as follows:
| SGX | HKEX | |
| Share Price | S$8.43 | HKD290.80 |
| Market Capitalisation | S$9,007.72m | HKD367,735.79 (Based on a conversion rate of HKD1.00 = SGD0.18, it converts to S$66,459.49m) |
Based on their market capitalisation, HKEX is 7 times bigger than the SGX.
Revenue (over the Past 10 Financial Years):
SGX:
SGX has a financial year end on 30 June. The following is the stock exchange’s revenue (in S$’mil) over the past 10 financial years – between FY2009/10 and FY2018/19:
| Financial Year | FY 2009/10 | FY 2010/11 | FY 2011/12 | FY 2012/13 | FY 2013/14 |
| Revenue (S$’mil) | S$639.7m | S$660.7m | S$647.9m | S$715.1m | S$686.9m |
| Financial Year | FY 2014/15 | FY 2015/16 | FY 2016/17 | FY 2017/18 | FY 2018/19 |
| Revenue (S$’mil) | S$778.5m | S$818.1m | S$800.8m | S$844.7m | S$909.8m |

SGX’s revenue went up from S$639.7m in FY2009/10 to S$909.8m in FY2018/19, with weaker year-on-year (y-o-y) results recorded in 3 out of 10 financial years.
Over the years, its revenue grew at a compounded annual growth rate (CAGR) of 3.59%.
HKEX:
HKEX has a financial year end on 31 December. As such, I will be looking at its revenue (in HKD’mil) over the past 10 financial years – between FY2010 and FY2019:
| Financial Year | FY2010 | FY2011 | FY2012 | FY2013 | FY2014 |
| Revenue and Other Income (HKD’mil) | HKD7,566m | HKD7,855m | HKD7,211m | HKD8,723m | HKD9,849m |
| Financial Year | FY2015 | FY2016 | FY2017 | FY2018 | FY2019 |
| Revenue and Other Income (HKD’mil) | HKD13,375m | HKD11,116m | HKD13,180m | HKD15,867m | HKD16,311m |

HKEX’s revenue and other income went up from HKD7,566m in FY2010 to HKD16,311m in FY2019, with weaker y-o-y performances recorded in just 2 out of the 10 financial years I have looked at.
Over the years, the stock exchange’s revenue improved at a CAGR of 7.98%.
Conclusion: While both countries’ stock exchanges saw y-o-y improvements in most years, HKEX’s revenue CAGR is far more superior compared to SGX’s.
Net Profit Attributable to Shareholders (over the Past 10 Financial Years):
SGX:
| Financial Year | FY 2009/10 | FY 2010/11 | FY 2011/12 | FY 2012/13 | FY 2013/14 |
| Net Profit Attributable to Shareholders (S$’mil) | S$320.1m | S$249.9m | S$291.8m | S$335.9m | S$320.4m |
| Financial Year | FY 2014/15 | FY 2015/16 | FY 2016/17 | FY 2017/18 | FY 2018/19 |
| Net Profit Attributable to Shareholders (S$’mil) | S$348.6m | S$349.0m | S$339.7m | S$363.2m | S$391.1m |
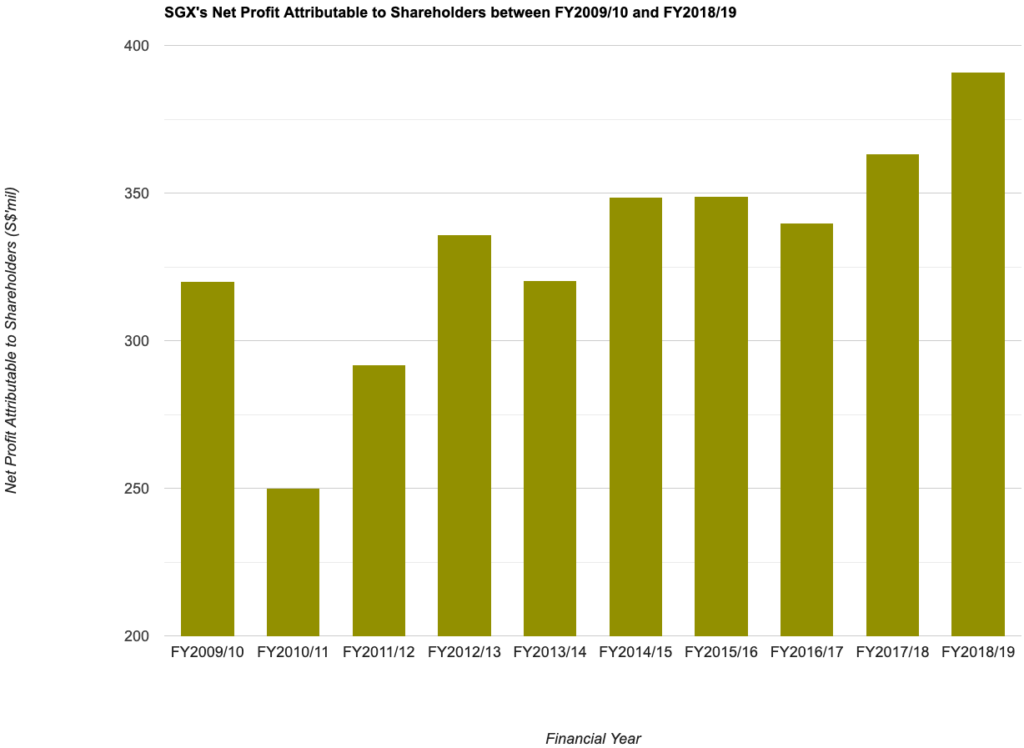
Similar to its revenue, SGX’s net profit attributable to shareholders saw y-o-y dips in 3 out of 10 financial years; despite of that, it still managed to grow from S$320.1m in FY2009/10 to S$391.1m in FY2018/19 – a CAGR of 2.02% over a 10 year period.
HKEX:
| Financial Year | FY2010 | FY2011 | FY2012 | FY2013 | FY2014 |
| Net Profit Attributable to Shareholders (HKD’mil) | HKD5,037m | HKD5,093m | HKD4,084m | HKD4,552m | HKD5,165m |
| Financial Year | FY2015 | FY2016 | FY2017 | FY2018 | FY2019 |
| Net Profit Attributable to Shareholders (HKD’mil) | HKD7,956m | HKD5,769m | HKD7,404m | HKD9,312m | HKD9,391m |

HKEX’s net profit attributable to shareholders, apart from in FY2012 and FY2016, where it saw y-o-y drops, improved in the remaining 8 financial years, where it grew from HKD5,037m in FY2010 to HKD9,391m in FY2019, a CAGR of 6.43%.
Conclusion: Again, in terms of CAGR of the two stock exchanges’ net profit attributable to shareholders, again HKEX fared much better than SGX.
Return on Equity (over the Past 10 Financial Years):
SGX:
| Financial Year | FY 2009/10 | FY 2010/11 | FY 2011/12 | FY 2012/13 | FY 2013/14 |
| Return on Equity (%) | 40.2% | 36.0% | 35.2% | 39.0% | 35.4% |
| Financial Year | FY 2014/15 | FY 2015/16 | FY 2016/17 | FY 2017/18 | FY 2018/19 |
| Return on Equity (%) | 36.7% | 35.5% | 33.6% | 34.1% | 35.8% |
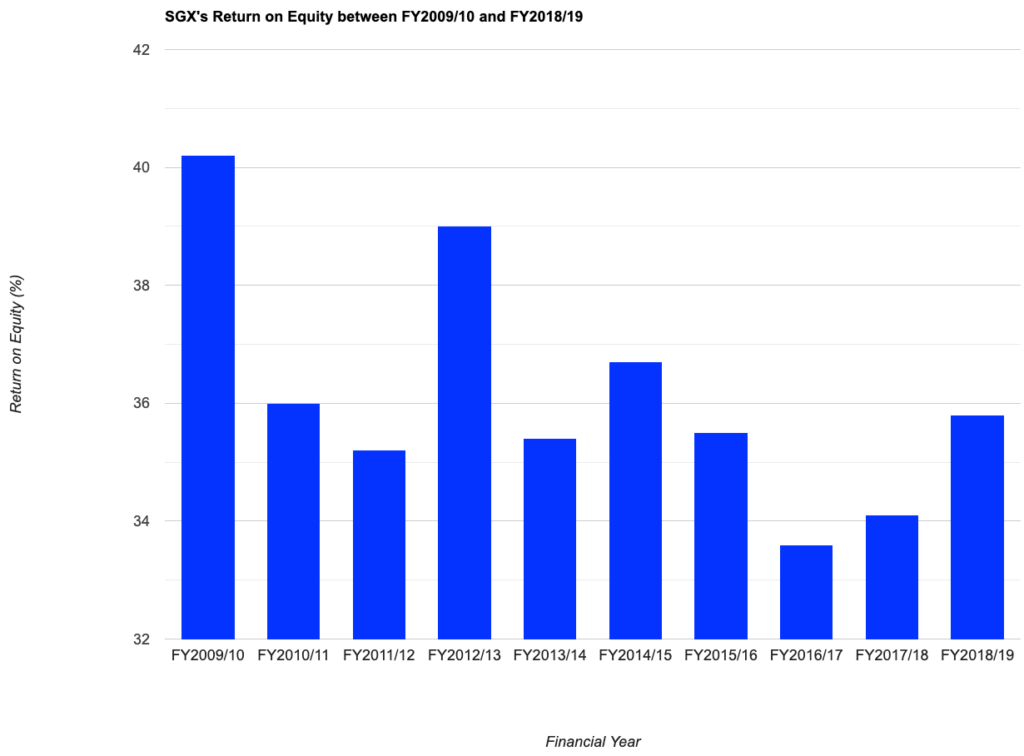
Apart from in FY2009/10, SGX’s return on equity have largely been hoovering in the range of 30+%.
HKEX:
| Financial Year | FY2010 | FY2011 | FY2012 | FY2013 | FY2014 |
| Return on Equity (%) | 58% | 56% | 23% | 22% | 24% |
| Financial Year | FY2015 | FY2016 | FY2017 | FY2018 | FY2019 |
| Return on Equity (%) | 27% | 18% | 20% | 23% | 21% |
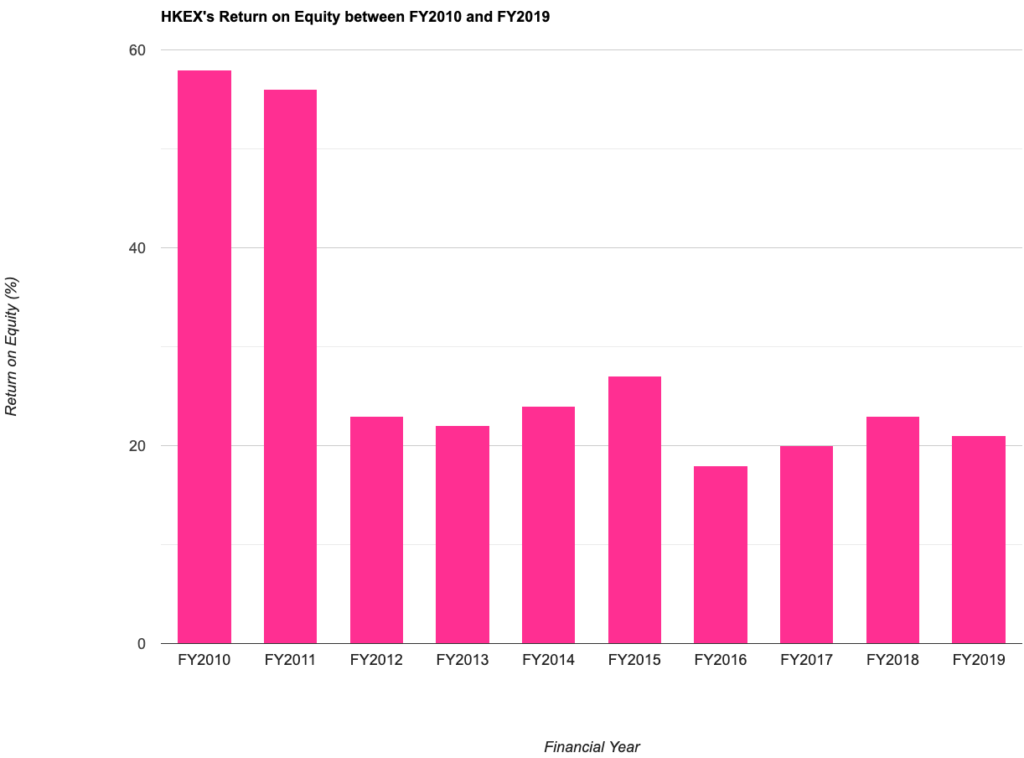
Apart from FY2010 and FY2011, HKEX’s return on equity have largely moved around the 20+% range.
Conclusion: Looking at both stock exchanges’ return on equity over the years, it seems that SGX has a better return on equity compared to HKEX.
Dividend Payout (over the Past 10 Financial Years):
While HKEX pays out a dividend to shareholders on a half-yearly basis, SGX pays out a dividend to shareholders on a quarterly basis.
In this section, let us take a look at the two stock exchanges’ dividend payout to shareholders over the past 10 financial years:
SGX:
| Financial Year | FY 2009/10 | FY 2010/11 | FY 2011/12 | FY 2012/13 | FY 2013/14 |
| Dividend Per Share (S$’cents) | 27.0 cents | 27.0 cents | 27.0 cents | 28.0 cents | 28.0 cents |
| Financial Year | FY 2014/15 | FY 2015/16 | FY 2016/17 | FY 2017/18 | FY 2018/19 |
| Dividend Per Share (S$’cents) | 28.0 cents | 28.0 cents | 28.0 cents | 30.0 cents | 30.0 cents |
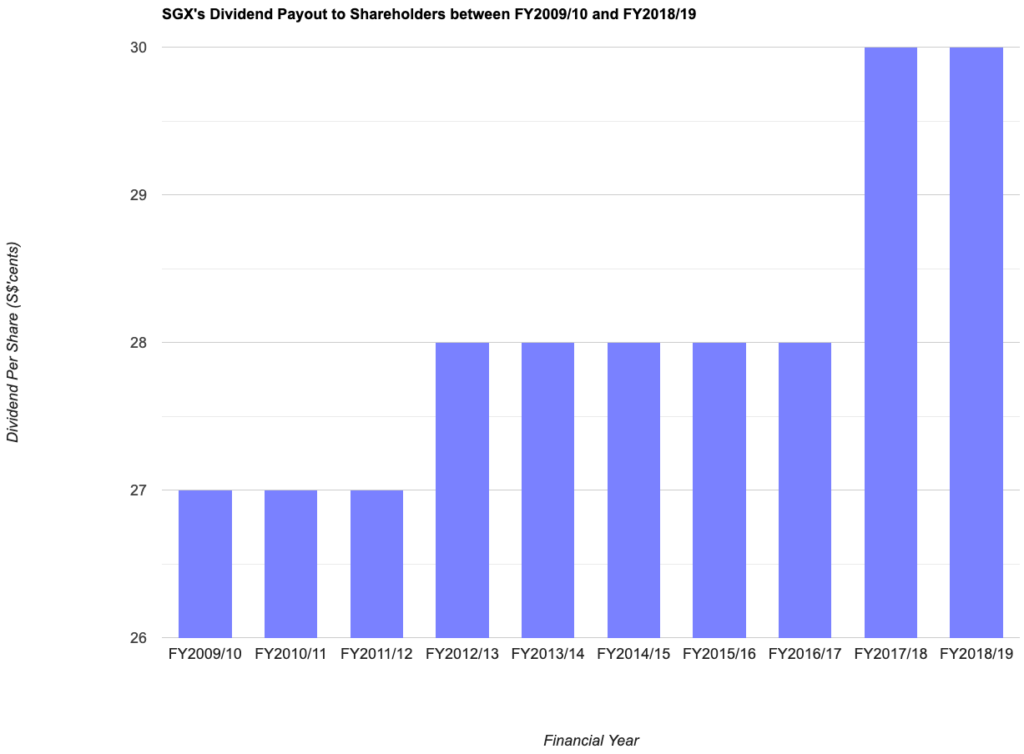
SGX’s total dividend payout have risen slowly over the years – from 27.0 cents/share in FY2009/10 to 30.0 cents/share in FY2018/19 – a CAGR of 1.06%.
HKEX:
| Financial Year | FY2010 | FY2011 | FY2012 | FY2013 | FY2014 |
| Dividend Per Share (HKD’cents) | HKD4.66 cents | HKD4.71 cents | HKD3.75 cents | HKD3.95 cents | HKD4.44 cents |
| Financial Year | FY2015 | FY2016 | FY2017 | FY2018 | FY2019 |
| Dividend Per Share (HKD’cents) | HKD6.70 cents | HKD4.76 cents | HKD6.03 cents | HKD7.50 cents | HKD7.49 cents |
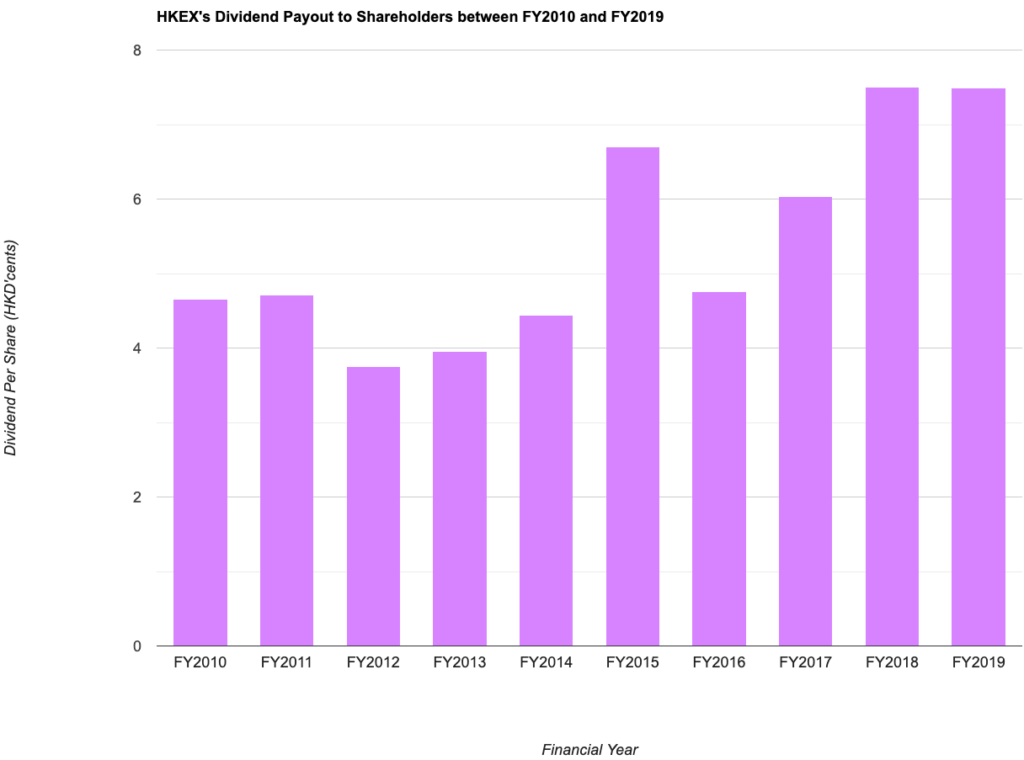
HKEX’s dividend payout to shareholders over the years saw dips in 3 out of the 10 financial years I have looked at. But despite of that, its dividend payout to shareholders over the years have gone up from HKD4.66cents/share in FY2010 to HKD7.49cents/share in FY2019 – a CAGR of 4.86%.
Conclusion: Both stock exchanges have a dividend payout ratio of about 90% over the years. While SGX’s dividend payout to shareholders have grown slowly and steadily over the years, but in terms of its CAGR, it has lost out to SGX – where SGX’s dividend payout to shareholders only grew at a CAGR of 1.06%, compared to a CAGR of 4.86% for HKEX.
Current Valuations:
The following are current valuations for both SGX and HKEX based on their share prices at the time of writing:
| SGX | HKEX | |
| Share Price | S$8.43 | HKD290.80 |
| P/E Ratio | 19.82 | 40.66 |
| P/B Ratio | 8.31 | 8.62 |
| Dividend Yield | 3.6% (computed based on total dividend payout of SGD 30 cents/share in FY2018/19) | 2.58% (computed based on total dividend payout of HKD 9.49 cents/share in FY2018/19) |
Conclusion: Putting the current valuations of the two countries’ stock exchange side-by-side, SGX is the “cheaper” of the two, with a lower current P/E and P/B ratios, along with a higher current dividend yield.
My Closing Thoughts:
As you can see from the above, while both countries’ stock exchanges have recorded improvements in their revenue, net profit attributable to shareholders, as well as dividend payouts to shareholders over the past 10 financial years, HKEX’s growth is far more superior compared to SGX’s.
However, in terms of their current valuations (based on their current share prices when I wrote this post), SGX is comparatively “cheaper” (perhaps due to its slower CAGR.)
That said, I am not recommending that you opt for SGX just because it is the “cheaper” between the two (based on its current valuations), or that you opt for HKEX because of its superior growth rate over SGX. The above research is just for educational purposes only. You need to do your own due diligence prior to making any investment decisions.
Disclaimer: At the time of writing, I am not a shareholder of Singapore Exchange Limited (SGX:S68) or HKEX Group (SEHK:388).
Are You Worried about Not Having Enough Money for Retirement?
You're not alone. According to the OCBC Financial Wellness Index, only 62% of people in their 20s and 56% of people in their 30s are confident that they will have enough money to retire.
But there is still time to take action. One way to ensure that you have a comfortable retirement is to invest in real estate investment trusts (REITs).
In 'Building Your REIT-irement Portfolio' which I've authored, you will learn everything you need to know to build a successful REIT investment portfolio, including a list of 9 things to look at to determine whether a REIT is worthy of your investment, 1 simple method to help you maximise your returns from your REIT investment, 4 signs of 'red flags' to look out for and what you can do as a shareholder, and more!

You can find out more about the book, and grab your copy (ebook or physical book) here...


Comments (0)