Just when it seemed that the STI was about to break above 2,650 points to start a new bull run, the bears rushed back in and stopped a possible “bull party” from happening – no thanks to the crude oil futures price plunging below $0 a barrel as a result of an oil glut – the first time in over a century, coupled with Singapore’s extension of the existing “Circuit Breaker” measures till 01 June in a bid to stop the community spread of Covid-19 in the country.
When trading for the week ended on Friday, 24 April, the STI lost 96 points, or about 3.7%, to close at 2,518 points (in so doing, it broke under the support line at 2,534 points):

Looking at the STI’s weekly share price movements, in the short trading week ahead (because Friday, 01 May is a Labour Day holiday in Singapore), my take is that, if the index could break above the 2,534 support turned resistance line, then it could possibly go up to the next level of resistance at 2,628 points (even if it does, there’s still no birth of a new bull run at this point.) Otherwise, if the downward fall continues, then the index could test the next level of support at 2,440 points.
Let us now take a look at each of the 30 blue chip companies’ share price movements last week based on their weekly timeframe, and how their share prices may possibly move over the next four trading days ahead.
Before you continue reading this post, do take note that everything you find within is based purely on my personal technical analysis for educational purposes only, and they certainly do not represent any buy or sell call for any of the companies listed below:
1. Ascendas REIT (SGX:A17U)
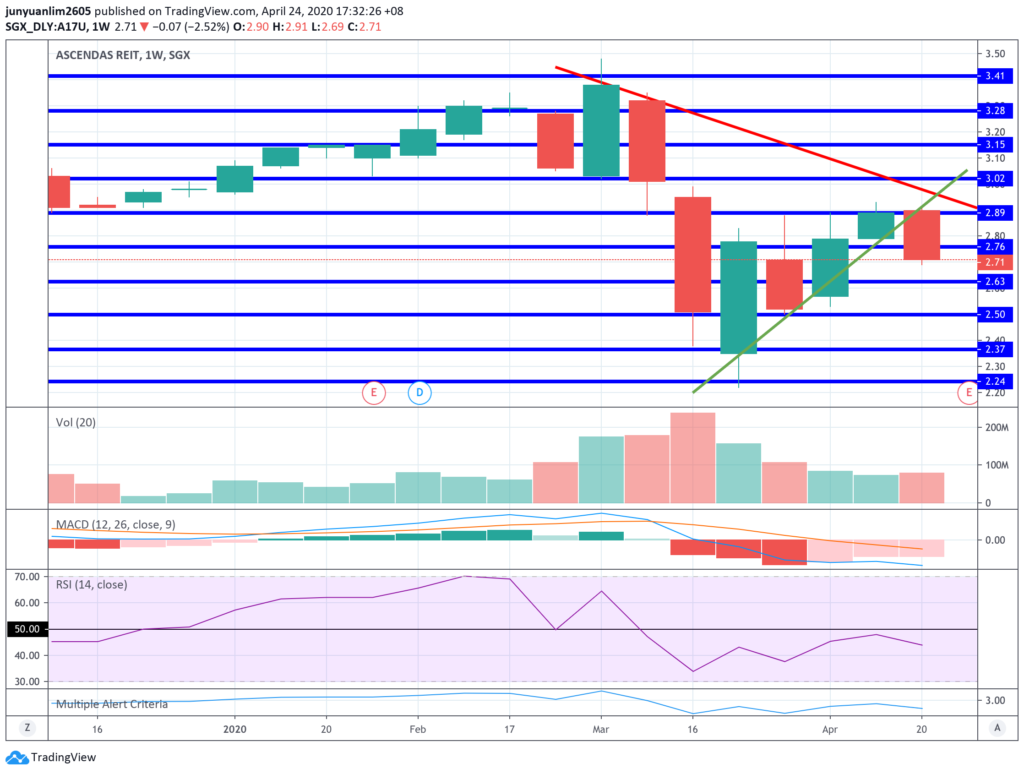
Ascendas REIT’s unit price failed to climb above the S$2.89 resistance line to trend higher last week. Instead, it plunged downwards – even breaking below the S$2.76 support line to close at S$2.71 last Friday (24 April.)
Looking at the most recent 2 weeks’ candlestick, it resembles a “bearish engulfing” candlestick pattern, suggesting the unit price may trend lower in the week ahead – where I feel it is likely to move towards the support line at S$2.63.
2. CapitaLand (SGX:C31)

CapitaLand’s share price reversed downwards last week, and closed right at the support line at S$2.82.
Two scenarios could happen in the week ahead – in a bullish scenario, it could bounce back up towards the resistance line at S$3.02; in a bearish scenario, it could break below the S$2.82 support line and move towards the next one at S$2.62.
3. CapitaLand Commercial Trust (SGX:C61U)

CapitaLand Commercial Trust’s unit price broke under the S$1.48 support line to close at S$1.43 on Friday, 24 April.
As last week’s trading volume is higher compared to the week before, it is likely that the bearish run may continue in the week ahead, where its unit price may move towards the S$1.35 support line.
4. CapitaLand Mall Trust (SGX:C38U)
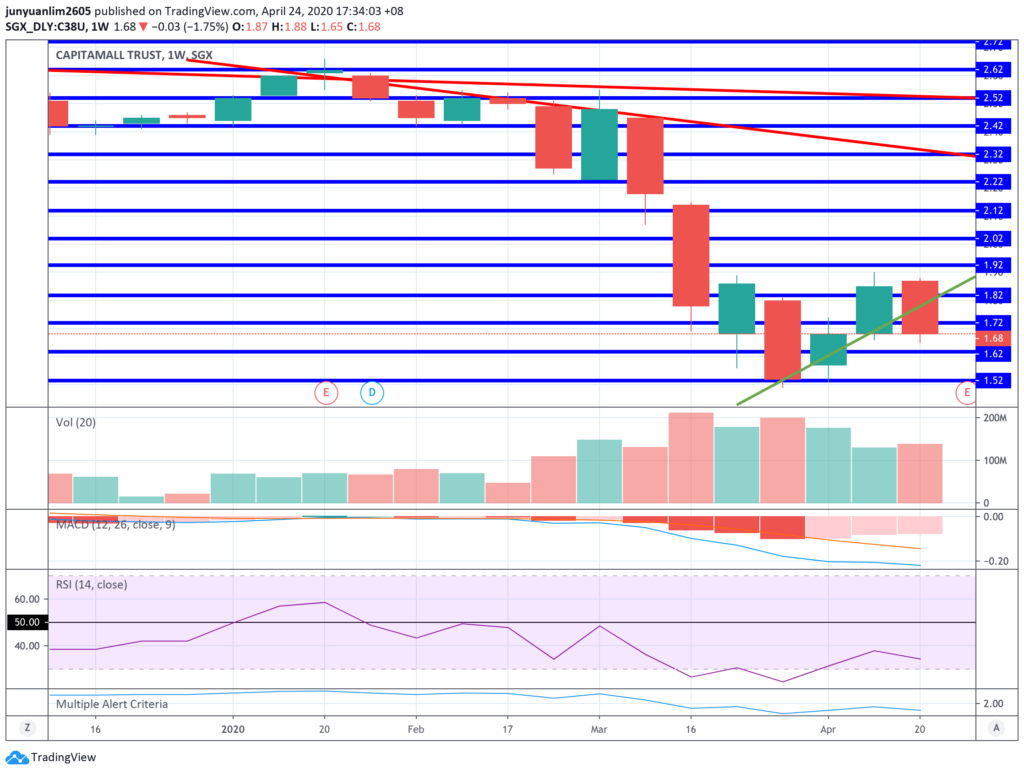
CapitaLand Mall Trust’s unit price broke above the resistance line at S$1.82, but later tumbled down, and even breaking under the S$1.72 support line to close at $1.68 last Friday (24 April.)
As last week’s trading volume is slightly higher compare to the week before, personally, I feel that the retail REIT’s unit price may continue to trend lower in the week ahead – where it may move towards the support line at S$1.62.
5. City Developments (SGX:C09)

City Developments’ share price broke under the S$7.56 support line to close at S$7.43 on Friday (24 April.)
Looking at its share price movements since late-March 2020, there appear to be a rejection of higher price above S$7.69. As such, in the week ahead, should the property developer’s share price manage to break above S$7.69 on a high volume, then it could go up further to the resistance line at S$8.23. Otherwise, it may continue to fall back to the green uptrend line at around S$7.25, and if it fails to bounce up from there, it may continue to move down towards the S$6.89 support line.
6. ComfortDelGro (SGX:C52)

ComfortDelGro’s share price closed at the S$1.43 support line last Friday. Looking at its candlesticks for the past couple of weeks, it seems that this is a very strong support line.
Should this support line be breached, then the share price of the public transport company could tumble towards the next support line at $1.17.
7. Dairy Farm International (SGX:D01)

The share price of Dairy Farm International moved above the US$4.88 resistance line during the week, but unable to trend higher from there. Eventually, it broke down this resistance turned support line to close at US$4.74 on Friday (24 April), and sitting just on the red downtrend line.
In the week ahead, should the share price of Dairy Farm International fall under the red downtrend line, it could further tumble down towards the US$4.36 support line. Otherwise, it could once again test the US$4.88 resistance line.
8.DBS (SGX:D05)

The share price of DBS reversed downwards during the week, and closed at the support line at S$18.67 on Friday, 24 April.
Two possible scenarios could happen in the week ahead in my opinion – in a bullish scenario, its share price could move towards the resistance line at S$19.75; in a bearish scenario, the bank’s share price could break under this S$18.67 support line and move towards the next support line at S$17.59.
9. Genting Singapore (SGX:G13)
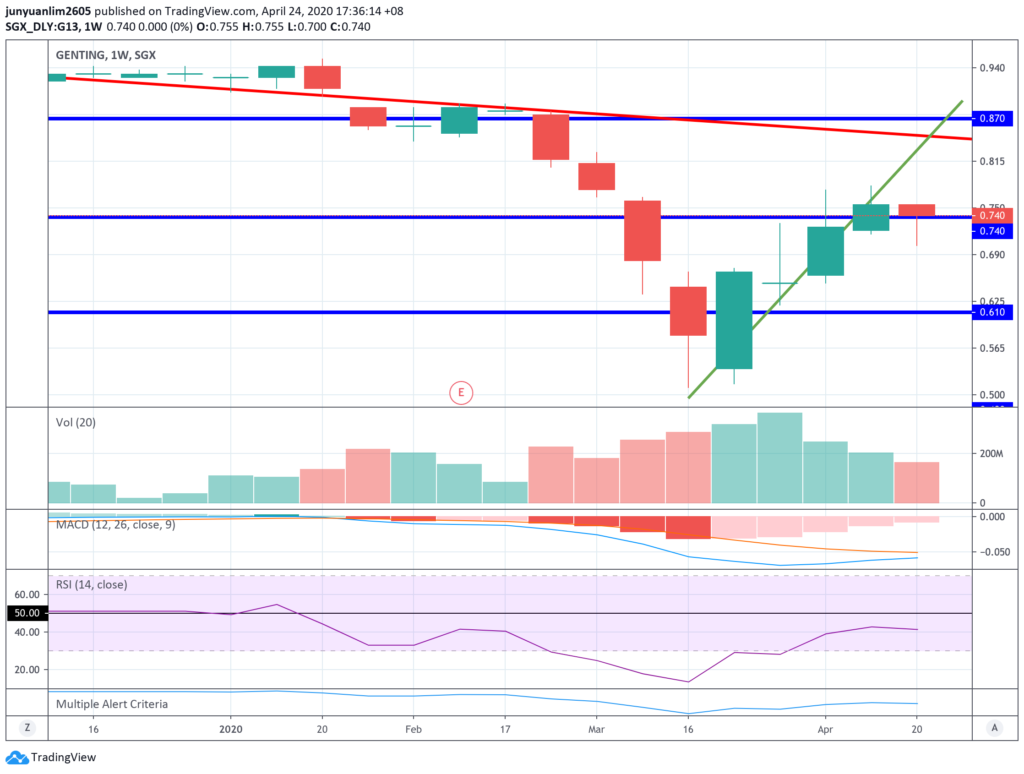
The share price of Genting Singapore closed at the S$0.740 support line. Looking at the candlestick for the 2 weeks (last week and the week before), there seem to be a rejection of higher prices above S$0.755.
As such, in the week ahead, if the share price could climb above S$0.755 on a high volume, then it could possibly move up to where the red downtrend line is at around S$0.840; otherwise, it could break below this S$0.840 support line and trend down towards the next support line at S$0.610.
10. Hongkong Land (SGX:H78)

The share price of Hongkong Land failed to break above the US$4.34 resistance line and bounced back down, where it closed at just one-cent above the support line on Friday (24 April.)
In the week ahead, the share price of Hongkong Land could either bounce back up once again towards the US$4.34 resistance line, or it could break under the US$3.99 support line and move towards the next support line at US$3.53.
11. Jardine Cycle & Carriage (SGX:C07)
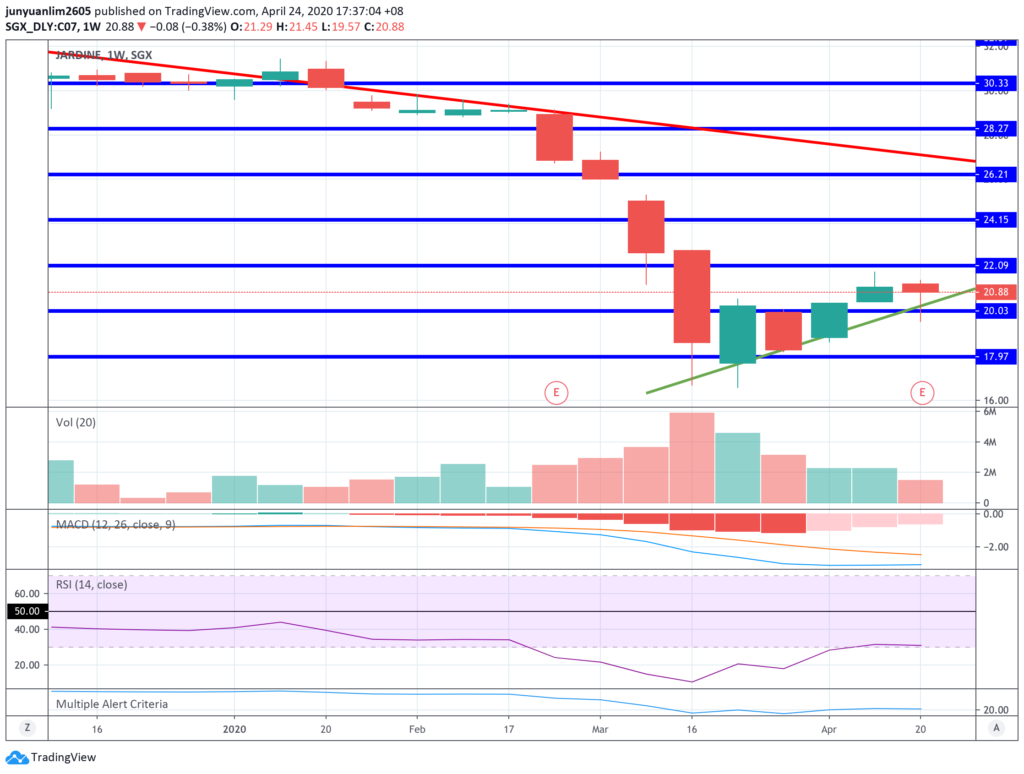
The share price closed at S$20.88 on Friday (24 April) – between the support line (at S$20.03) and resistance line (S$22.09.)
In the week ahead, I personally feel that the company’s share price could move in either direction – either towards the support or resistance line.
12. Jardine Matheson (SGX:J36)

Jardine Matheson’s share price took a tumble last week, where it fell by US$6.56 (or 12.22%) to US$47.11 – in the process, it broke under the US$49.75 support line.
Looking at the MACD, it is likely that the share price is likely to trend lower in the week ahead, where it could possibly move towards the US$44.60 support line.
13. Jardine Strategic (SGX:J37)
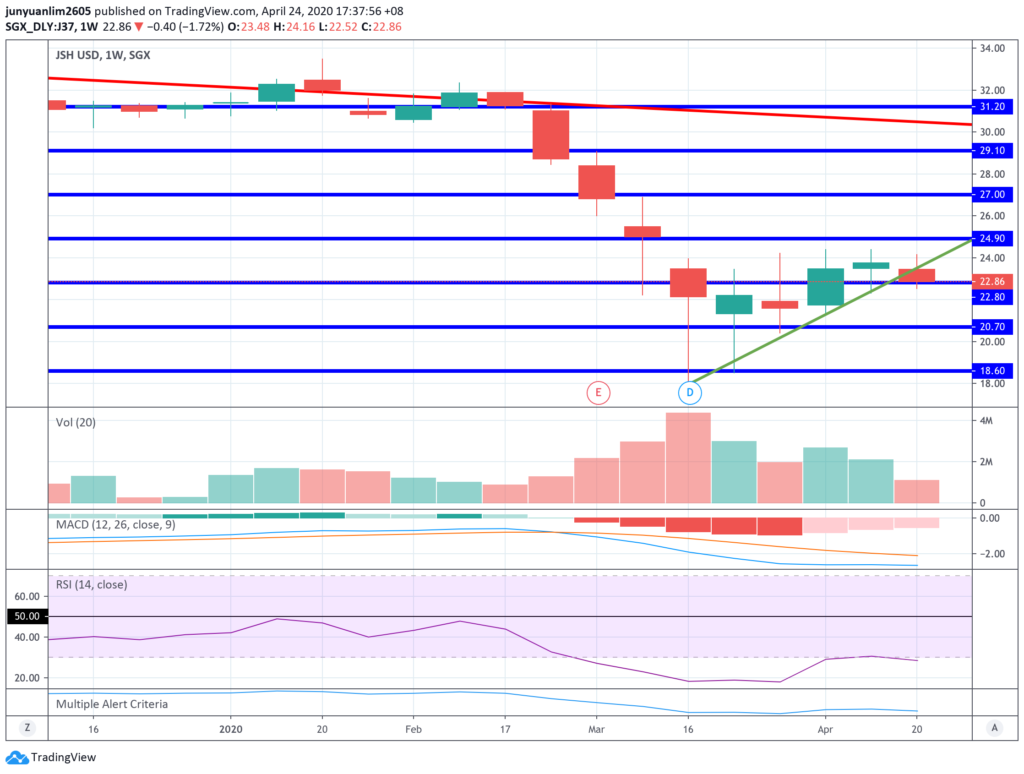
Jardine Strategic’s share price failed to improve on last week slight movement upwards, where it closed at US$22.86, just 6 US cents above the US$22.80 support line.
Personally, I feel that the company’s share price may move in either direction in the week ahead – in a bullish scenario, it could move up to the US$24.90 resistance line; in a bearish scenario, it could break under the US$22.80 support line and move towards the next support line at US$20.70.
14. Keppel Corporation (SGX:BN4)

Just like the week before, the share price of Keppel Corporation hit the S$5.76 resistance line, failed to break above it, and bounced downwards – when trading for the week ended last Friday (24 April), it closed at S$5.69.
In the week ahead, I feel that its share price may once again attempt to break above the S$5.69 resistance line – should it be able to do so on a high volume, then it could move up towards the S$6.36 resistance line.
15. Mapletree Commercial Trust (SGX:N2IU)

Mapletree Commercial Trust’s unit price attempted to break above the S$1.87 and tried to trend higher from there, but failed to do so and ended up plunging down, and breaking slightly below the S$1.77 support line to close at S$1.76.
In my personal opinion, two scenarios could happen in the week ahead – it could either move upwards above the S$1.77 resistance line and move towards the next resistance line at S$1.87, or it could continue to trend downwards towards the S$1.67 support line.
16. Mapletree Logistics Trust (SGX:M44U)

Mapletree Logistics Trust’s unit price trended upwards during the week, where it briefly broke above the S$1.79 resistance line, but the upward momentum failed to sustain and eventually broke down to close just one-cent above the S$1.72 support line. The logistic’s REIT is also sitting on the green downtrend line.
In the week ahead, it could bounce upwards from this green uptrend line, where it could move towards the S$1.79 resistance line. However, if the unit price breaks under the S$1.72 support line on a high volume, then it could potential move lower towards the S$1.65 support line.
17. OCBC (SGX:O39)
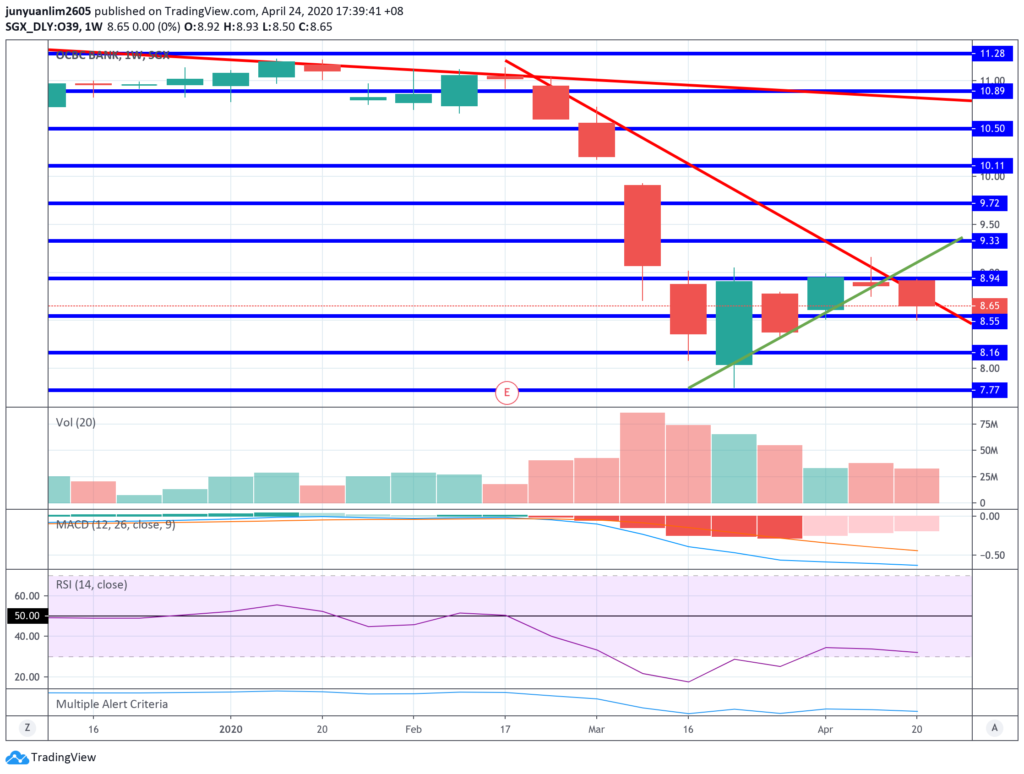
The share price of OCBC failed to break above the S$8.94 resistance line and bounced downwards, where it fell just under the red downtrend line to close at S$8.65 last Friday (24 April.)
Should the share price fail to break above this red downtrend line in the week ahead, then it could move towards the S$8.55 support line.
18. SATS (SGX:S58)
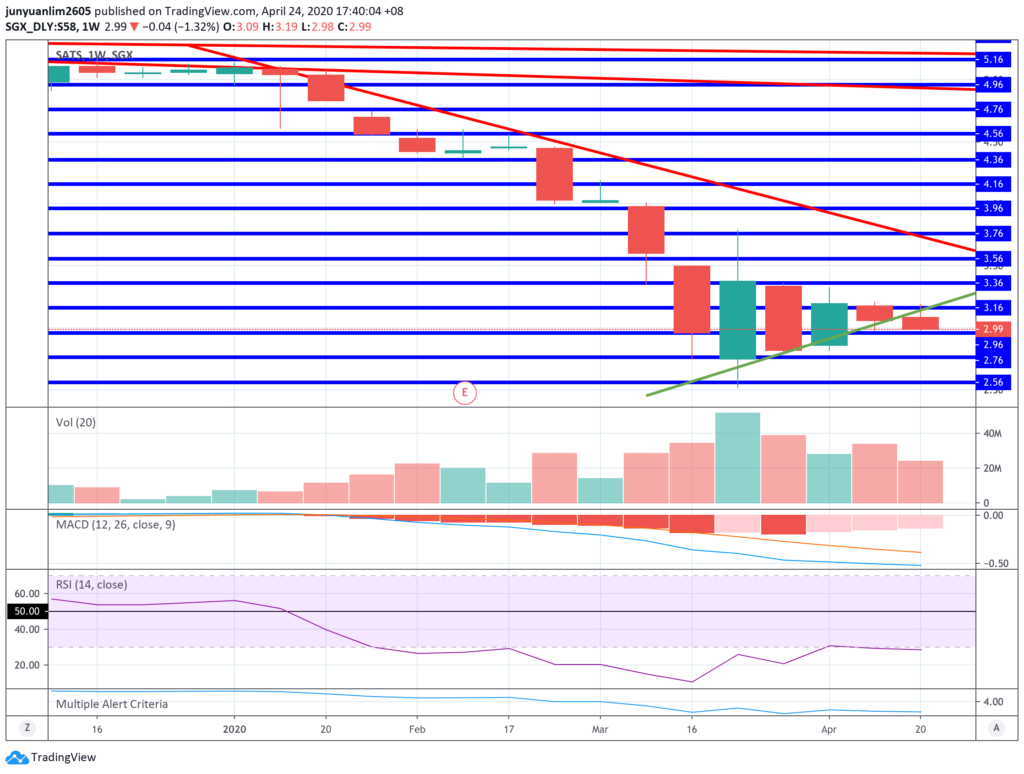
SATS’ share price continued to trend lower last week, where it closed at S$2.99, 3-cents above the support line at S$2.96.
Looking at the declining trading volume for the last 2 weeks (last week and the week before), it is likely that the share price may rebound in the week ahead towards the S$3.16 resistance line. However, if the share price were to continue to weaken and break under the S$2.96 support line on a high volume, then it could move towards the next support line at S$2.76.
19. Sembcorp Industries (SGX:U96)

Sembcorp Industries’ share price finished the trading week last Friday (24 April) at S$1.50, just one cent above the support line at S$1.49.
Looking at the candlesticks for the past couple of weeks, it seems that the share price seem to bounce back up whenever it hits this S$1.49 support line; as such, in the week ahead, I feel that there could be some form of recovery in Sembcorp Industries’ share price – where it could possibly move up to where the red downtrend line is at around S$1.57 – if it is able to break above this line on a high volume, then its share price could move towards the S$1.70 resistance line.
20. SGX (SGX:S68)
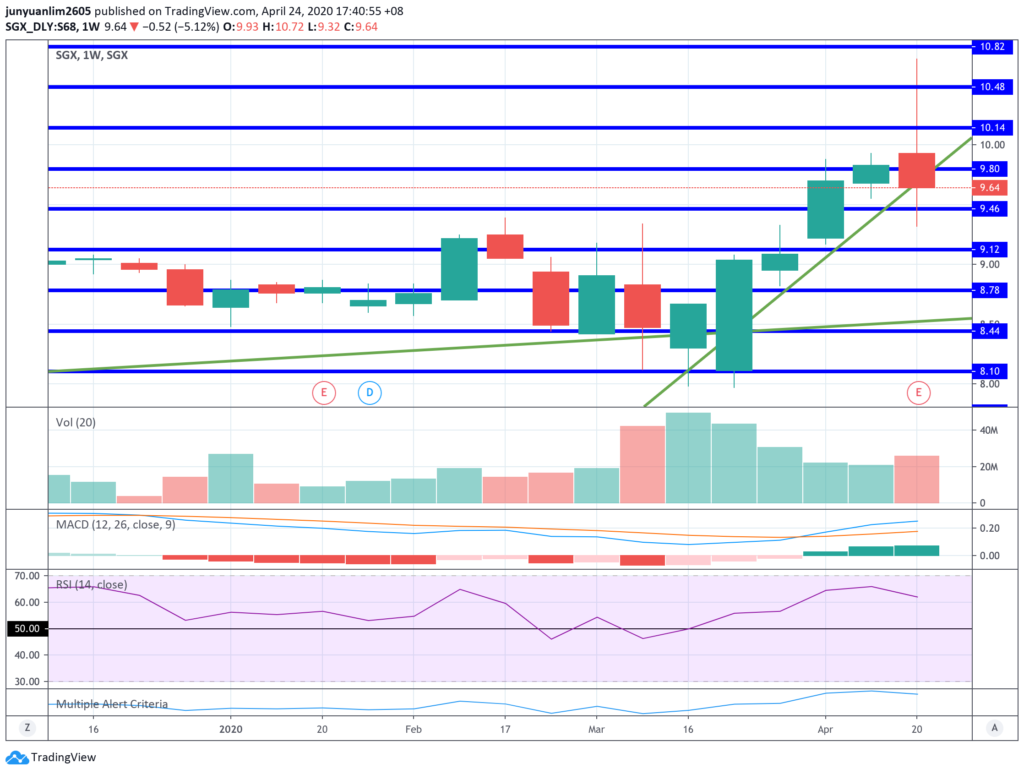
After hitting a new 52-week high at S$10.72, SGX’s share price movement slumped where it closed even lower than the week before, at S$9.64 – right at where the green uptrend line is.
In the week ahead, should the company’s share price be able to bounce up from this green uptrend line, it could once again re-test the resistance line at S$9.80 and continue its upward movement; otherwise, its share price could move down towards the S$9.46 support line.
21. SIA (SGX:C6L)

Singapore Airlines’ share price hit the red downtrend line and also the resistance line at S$6.22, failed to break above, and bounced downwards, to close at S$6.04 last Friday.
In the week ahead, its share price could either once again try to break above the same red downtrend and resistance line again, or its share price could move down towards the S$5.82 support line.
22. SingTel (SGX:Z74)

SingTel’s share price failed to break above the red downtrend line at S$2.77, bounced down under the S$2.74 support line and closed at S$2.70 last Friday (24 April.)
In the week ahead, I feel that the company’s share price may attempt to once again break above the same red downtrend and resistance line – and if it is able to do so successfully, then it could trend upwards towards the next resistance line at S$2.92. Otherwise, it could move down towards the S$2.56 support line.
23. SPH (SGX:T39)

SPH’s share price continue to weaken, where it broke under the S$1.50 support line on a high trading volume to close at S$1.45.
In the week ahead, my opinion is that it is highly likely that the company’s share price will trend lower towards the next support line at S$1.35.
24. ST Engineering (SGX:S63)
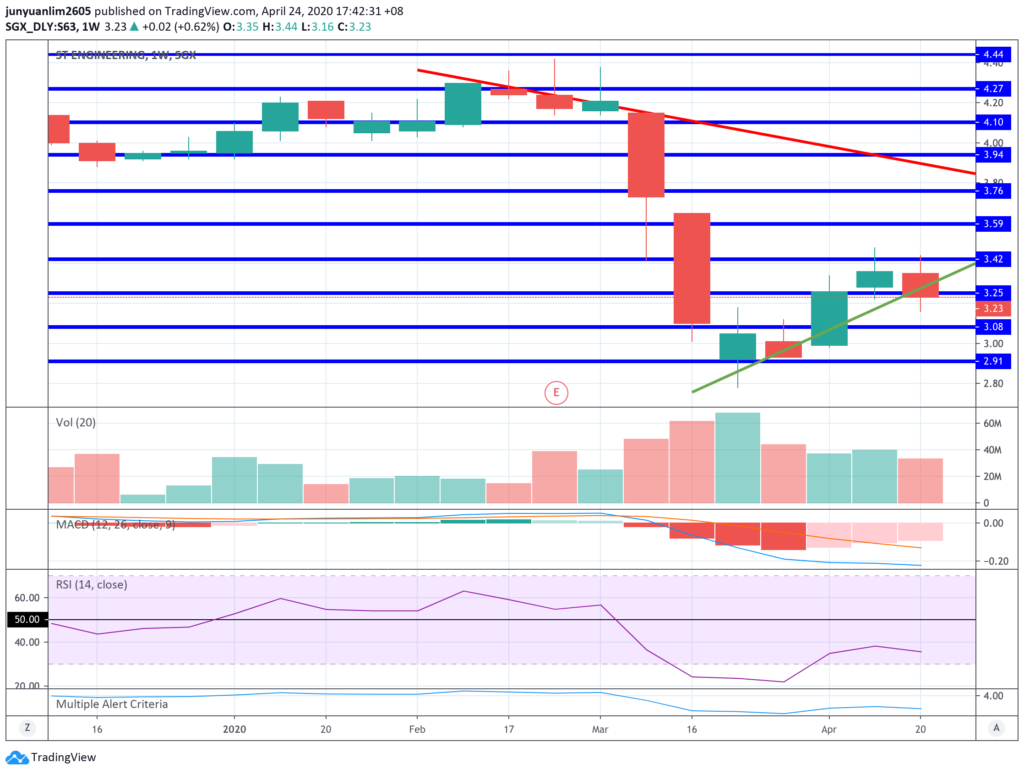
ST Engineering’s share price failed to break above the S$3.42 resistance line and trend higher, and bounced down (and even breaking under the S$3.25 support line) to close at S$3.23 last Friday (24 April.)
In the week ahead, its share price may bounce back up, where it may break above the S$3.25 support turned resistance line and try to break the S$3.42 resistance line once again. Otherwise, its share price may continue to trend lower, where it could possibly move towards the S$3.08 support line.
25. ThaiBev (SGX:Y92)
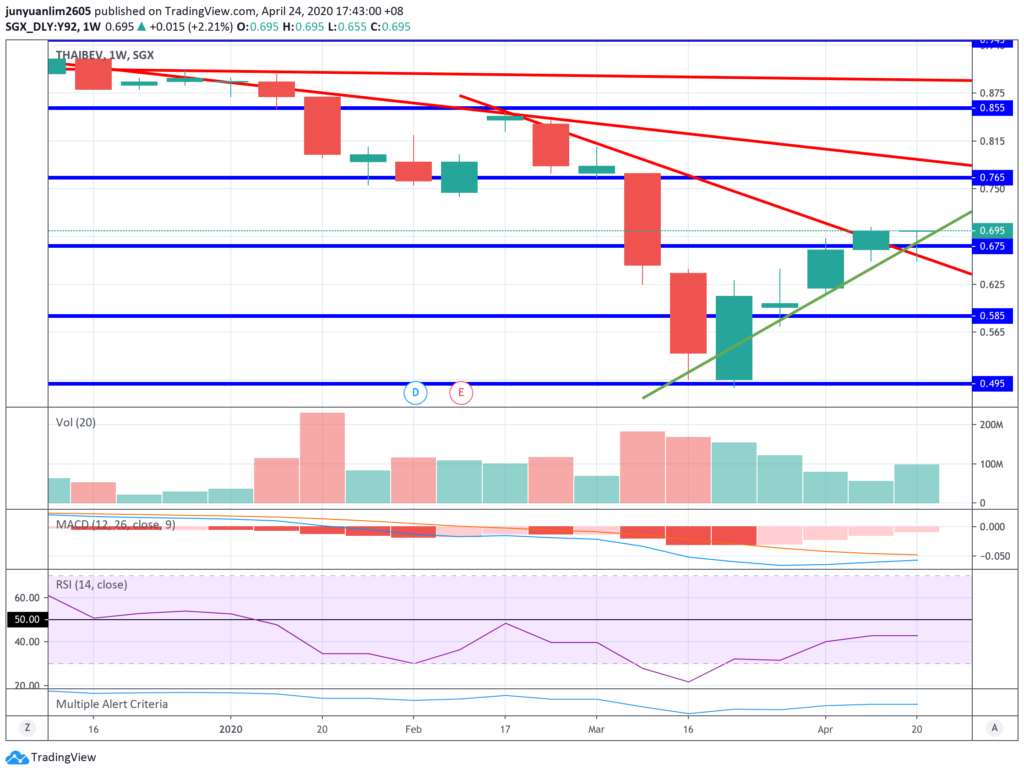
ThaiBev’s share price ended the trading week unchanged at S$0.695, and sitting on the green uptrend line.
Looking at the MACD, it seems likely that the beverage company’s share price may move upwards towards the S$0.765 resistance line in the week ahead.
26. UOB (SGX:U11)

UOB’s share price failed to break above the S$20.37 resistance line and bounced down to close at S$19.56 last Friday (24 April.)
In the week ahead, I feel that the share price could move in two possible directions – in a bullish state, it could once again try to break above the same resistance line and also the red downtrend line and trend higher towards the next resistance line at S$21.82; in a bearish state, its share price could move towards the S$18.92 support line.
27. UOL (SGX:U14)

Looking at last week’s candlestick, it seems that UOL’s share price is unable to break above the red downtrend line at S$6.89 and bounced under the S$6.83 support line to close at S$6.76.
In the week ahead, its share price could either break above the S$6.83 resistance line, and also above the S$6.89 red downtrend line to move towards the next resistance line at S$7.31. If it fail to break above this resistance line and red downtrend line, it could move down towards the S$6.35 support line.
28. Venture Corporation (SGX:V03)
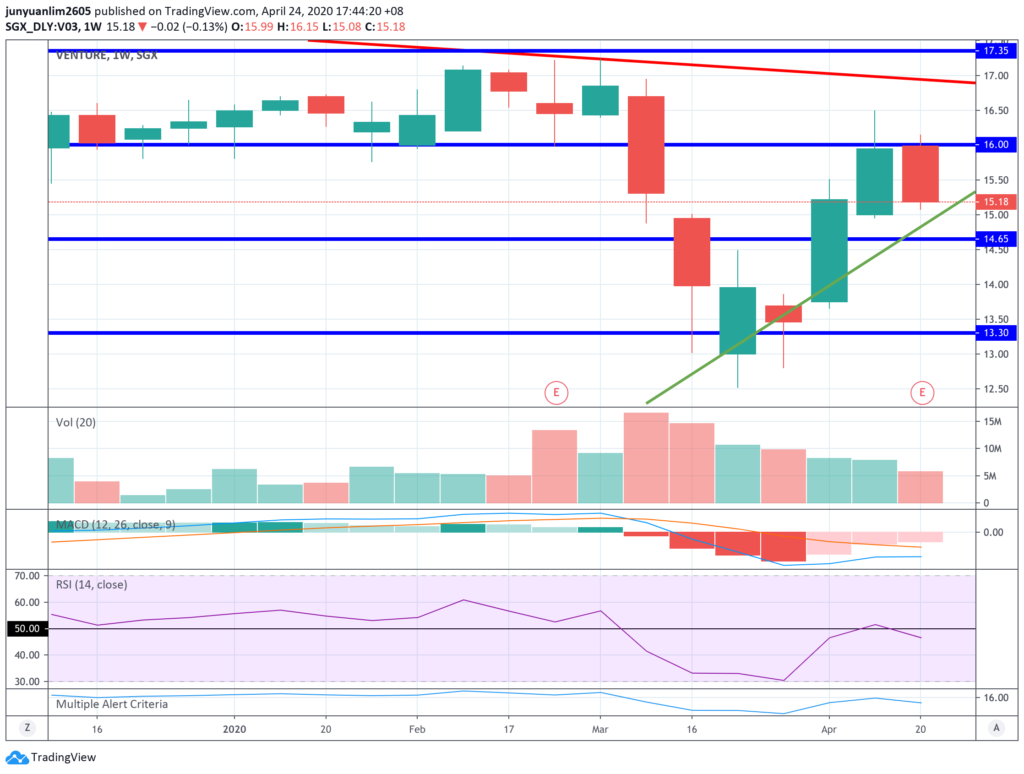
Venture Corporation’s share price failed to break and trend above the S$16.00 resistance line, but instead, it tumbled from there and closed at S$15.18 last Friday (24 April.)
In the week ahead, its share price could move in two possible directions – either up towards the S$16.00 resistance line (where it will try to break above it again), or down towards the S$14.65 support line.
29. Wilmar International (SGX:F34)

Wilmar International’s share price broke slightly under the S$3.41 support to close at S$3.39 last Friday (24 April.)
Personally, I feel that its share price could move in either direction in the week ahead – in a bullish state, it could break above the S$3.41 support turned resistance line and move towards the next resistance line at S$3.54; in a bearish state, it could move towards the S$3.28 support line.
30. Yangzijiang Shipbuilding (SGX:BS6)

The share price of Yangzijiang failed to break above the red downtrend line (just like the week before), and bounced back down to close at S$0.980 last Friday (24 April.)
In the week ahead, it could either bounce back up after hitting the green uptrend line at around S$0.980, up towards this red downtrend line (and attempt to break above it once again), or it could break under this green uptrend line and head down towards the support line at S$0.895.
Notice: No Weekly Updates on the STI’s and 30 Blue Chip Companies’ Share Price Movements Next Monday 04 May 2020
Due to the lack of time (as I will be occupied with summarising, drafting and posting highlights of DBS’ upcoming AGM this coming Thursday, 30 April 2020), I will not be posting any weekly updates on the STI’s, as well as 30 blue chip companies’ share price movement next Monday, 04 May 2020.
You can find the next weekly update the following Monday, 11 May 2020. My apologies for any inconveniences this may have caused.
Disclaimer: Please note that the above sharing is for your educational purposes only, and it does not imply any buying/selling calls for any of the companies above. At the time of writing, I am a shareholder of Ascendas REIT, CapitaLand Mall Trust, ComfortDelGro, DBS, Mapletree Commercial Trust, SATS, SIA, SingTel, OCBC, and UOB.
Are You Worried about Not Having Enough Money for Retirement?
You're not alone. According to the OCBC Financial Wellness Index, only 62% of people in their 20s and 56% of people in their 30s are confident that they will have enough money to retire.
But there is still time to take action. One way to ensure that you have a comfortable retirement is to invest in real estate investment trusts (REITs).
In 'Building Your REIT-irement Portfolio' which I've authored, you will learn everything you need to know to build a successful REIT investment portfolio, including a list of 9 things to look at to determine whether a REIT is worthy of your investment, 1 simple method to help you maximise your returns from your REIT investment, 4 signs of 'red flags' to look out for and what you can do as a shareholder, and more!

You can find out more about the book, and grab your copy (ebook or physical book) here...


Comments (0)