One look at the STI’s weekly movements over the years below, what does it tell you?

That’s right – the overall movement of Singapore’s benchmark index since 1998 has been upwards.
However, it’s not all smooth sailing for the index. Over the years, there are 6 occasions (including the latest fall of the index into bear territory due to Covid-19) where the index fell by over 20% from its peak (back then) to commence a bear market, and thereafter, it recovered by over 20% from its trough (which is the lowest point the index fell from its high) to commence the birth of a new bull market, and thereafter the index starts to climb from there to form a high before falling once again, resulting in the emergence of another bear market, and the entire process repeated itself over the years.
Today, I’d like to zoom in and take an in-depth look at all the 6 bear markets since 1993 – where I looked at the timeframe it took for the market to fall from its peak to 20% off its peak (birth of a bear market), down to its bottom (to find out how much the index have fallen from its top to its bottom), and thereafter, the timeframe it took for the market to bounce back up 20% above its bottom (birth of a bull market), and the period of bull market thereafter (and how much the market have climbed from its bottom to its highest point.)
Before I begin, I’d like to stress that everything that you may read in this post is my personal sharing for educational purposes only. It does not represent any buy or sell call to trade or invest in the index.
Now let’s get started:
1. From January 1994 to February 1997

From 1,059 points in October 1992 (the furthest I can capture with my TradingView account), the STI climbed to its peak at 2,138 points in January 1994 (a gain of 109.9%), before the index tumbled down by 20% from its peak to 1,710 points in March 1994 (2 month period.)
There was some form of recovery thereafter, but the index fell again, this time a bottom was formed in June 1995 at 1,584 points (from the peak at 2,138 points in January 1994, it fell to its bottom at 1,584 points in 1.5 years, a drop by 25.9%.)
The index started to recover once again, and a new bull market emerged in December 1995 (6 months after the market saw its bottom), where it went up by 20% from its bottom, and a new peak was formed in February 1996 – from the market bottom in June 1995, it took 8 months for the index to climb to a new peak in February 1996.
While the index fell to a low of 1,791 points in July 1996, it was not considered a bear market as the drop was less than 20% from its peak of 2,163 points (formed in February 1996.) Subsequently, the index recovered and peaked at 2,127 in February 1997 (one year after its peak in February 1996.) From its bottom (at 1,584 points in June 1995 to its peak at 2,127 points in February 1997, the index grew by 34.2%.)
2. From February 1997 to January 2000
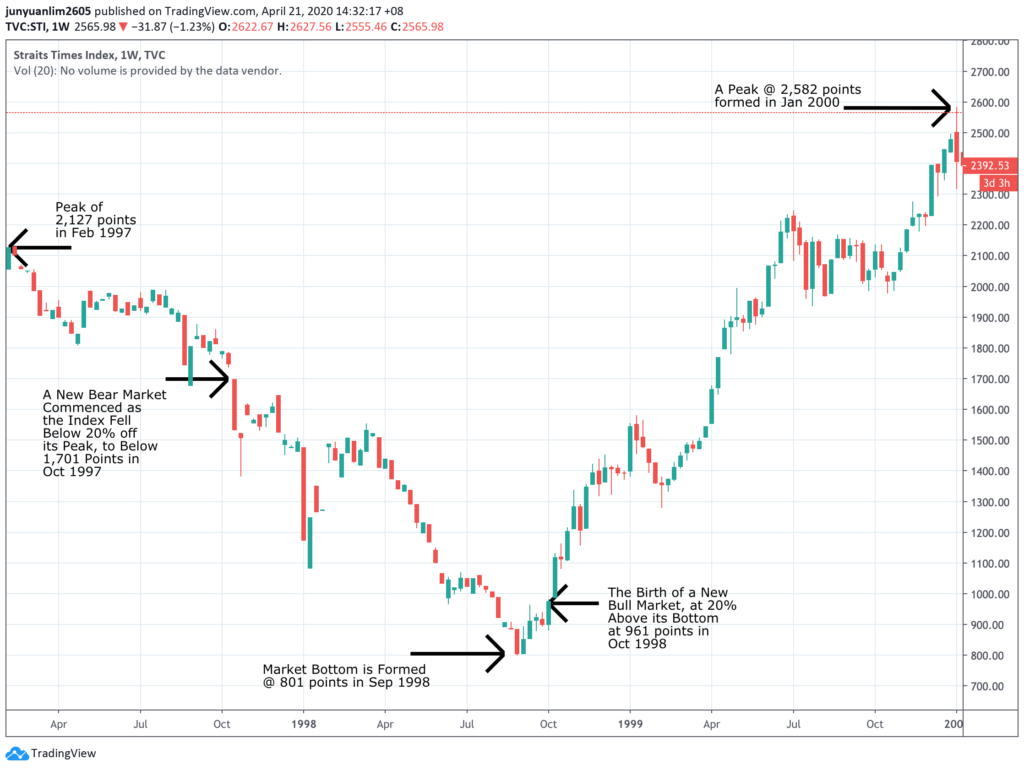
From a high of 2,127 points in February 1997, a new bear market was formed once again in October 1997, when the index fell more than 20% from its high below 1,701 points. The index continued its downward drop an a bottom was formed at 801 points – from its peak at 2,127 points, the STI fell by 62.1% in a total of 19 months (from February 1997 to September 1998.)
However, within a month, a new bull run emerged once again, when the market recovered by more than 20% above its bottom in October 1998. From there, it was bullish all the way, and another new high was formed in January 2020, at 2,582 points – in a total of 16 points (from its bottom in September to a new high in January 2000), the index went up by 69.0%!
3. January 2000 to October 2007
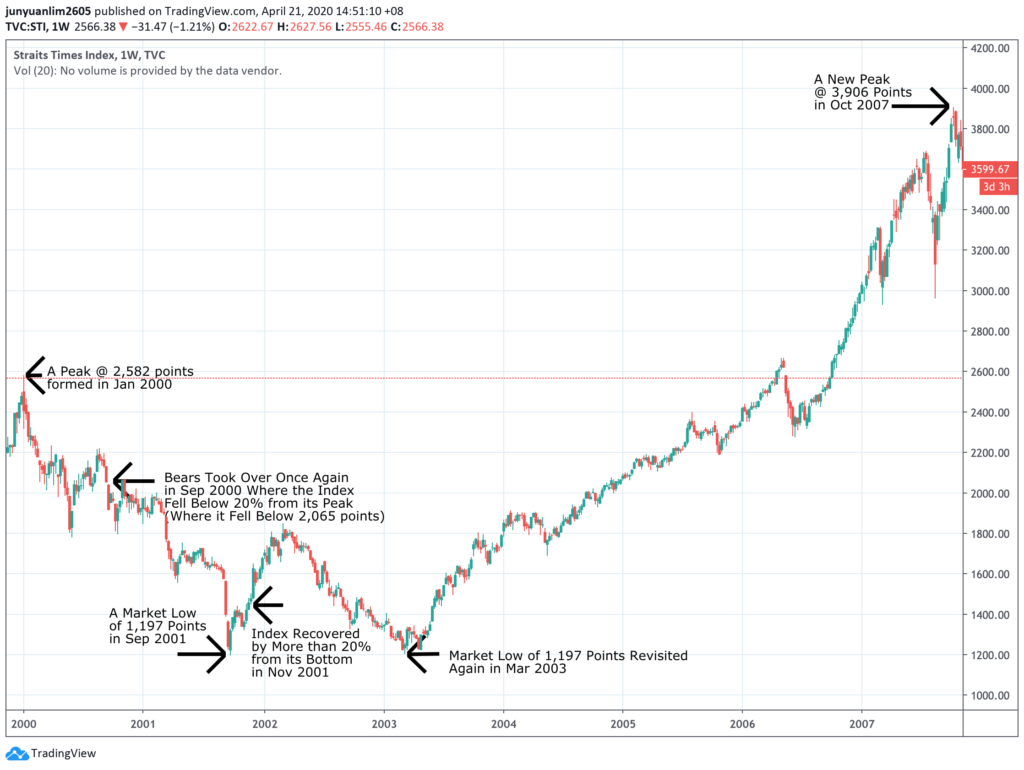
After reaching a high of 2,582 points in January 2000, the index started to fall once again, and the bears took over in September 2000 when the index fell by more than 20% from its high (to under 2,065 points.)
The index continued its downfall from there, and market bottom at 1,197 points was formed in September 2001. While it managed to recover by more than 20% from its bottom in November 2001 to form a new bull run, but it is short-lived, as shortly after, the market re-visited the bottom once again in March 2003 (from its peak to trough, the STI fell by 53.6%), before starting its multi-year climb – lasting from March 2003 all the way to October 2007, where the index grew by 226.3% from its bottom at 1,197 points to a new peak at 3,906 points – its growth was the highest I’ve seen from the STI over the years so far.
In this period (between January 2000 to October 2007), we see something like a “W” shape forming, where the index fell from its high to its low, rebounded, revisited its low, before rebounding up and forming a new high from there – from its peak in January 2000, it took a total of about 21 months to visit its low in September 2001, and from there, the low was re-visited once again after 18 months in March 2003. However, from there on, it took a total of 55 months for the index to climb to a new high at 3,906 points in October 2007.
4. October 2007 to April 2015

After reaching a new high of 3,906 points in October 2007, the STI fell once again, and the bears officially took over from February 2008, where the index fell by more than 20% below its high to under 3,124 points.
The index continued to plunge from there, and a market bottom was formed at 1,457 points in March 2009 (a drop by 62.7% from its peak in 17 months.) However, the index quickly recovered, an a new bull market emerged just one short month after the bottom was formed, where the index rose by more than 20% off its bottom, and another bull run continued for a total of 72 months (or 6 years) to a high of 3,550 points in April 2015 – a growth by 59.0% from its bottom.
5. April 2015 to April 2018
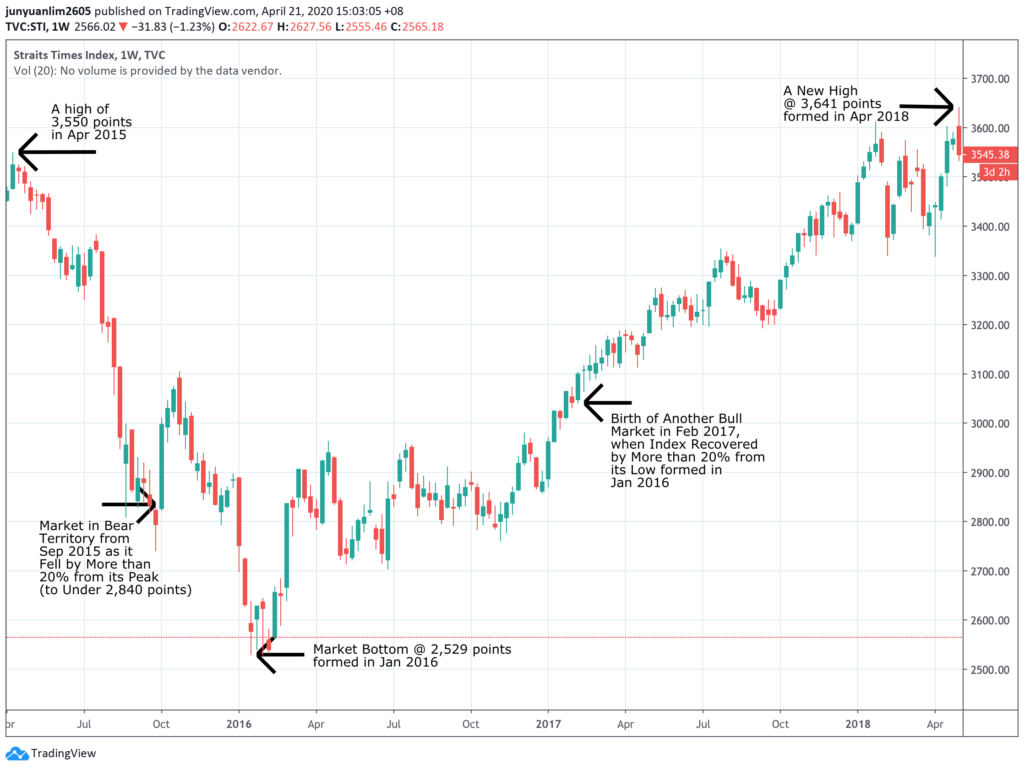
The STI fell again after peaking at 3,550 points in April 2015, with the index once again in bearish territory in September 2015, where it fell under 2,840 points (down by more than 20% from its peak formed in April 2015.)
While there was some recovery shortly after to 3,104 points in October 2015, the index continued its downward fall once again, and a market bottom was formed in January 2016 at 2,529 points – from its peak to its trough, it took a total of 8 months, and the index fell by 28.8%.
The index eventually recovered, with the bulls re-taking over once again in February 2017, slightly a year after the index hit a bottom (in January 2016), where it rose above 20% from its bottom. From there, the index continued its upward climb to a peak (and also a new high) of 3,641 points in April 2018 – in total, the index climbed by 44.0% in 27 months.
6. April 2018 to Time of Writing (22 April 2020)

As you can see from the movements of the STI since April 2018, it has been trending on a downward direction, and moving in a range of around 3,100 and 3,380 points between June 2018 and February 2020 before plunging since then (due to fears of Covid-19.)
STI fell into bear territory in early March 2020, where it dropped by more than 20% from its peak of 3,641 points (formed in April 2018.)
Looking at the recent movements of the index, it seems to me that a bottom may have been formed at 2,208 points in late-March 2020 and there seems to be a bounce up from there (assuming that 2,208 points is the bottom, the index have fallen by 39.4% from its peak.)
For the birth of bull run once again, the index must rebound by more than 20% from its bottom – assuming the bottom is formed at 2,208 points, then in order for bull run to emerge, the index must cross above 2,650 points.
At the time of writing, there is no bull run just yet, as the index is still under 2,650 points.
In Conclusion
Looking at the ups and downs of the STI since October 1992, it seems to me that the harder the index fell (from its peak to its bottom), the higher will its recovery be. Also, you can see that over the years, the bull runs last much longer than the bear runs.
With regard to the current ongoing bear market, I have no answer at this point in time as to when the STI will hit above 2,650 points (to start another run of bull run), or will it form a “W” shape recovery from here. Both scenarios are possible at this point in time (as I am writing this post.)
If you’re interested in my further analysis of the movements of the STI, do keep a lookout for my posting every Monday, where I take a look at the movements of the index, along with possible movements of all 30 blue chip companies for the particular week ahead.
Stop Spending Hours Reading REIT Reports Every Quarter!
What if you could assess a REIT's portfolio occupancy, debt profile, valuation, and overall health in less than 30 seconds - without having to comb through a single quarterly report?
That's the problem the REIT Screener was built to solve.
Developed through a collaboration between ShareInvestor and The Singaporean Investor, the REIT Screener consolidates many of the key metrics and indicators I personally use when analysing REITs into one easy-to-use platform. Instead of spending hours extracting data manually every earnings season, you can now monitor the REITs you own and research new opportunities in just a few clicks.
If you're serious about REIT investing but don't have the time to manually track quarterly developments, the REIT Screener could be the shortcut you've been looking for:

Take a closer look at the REIT Screener here...


Comments (4)