Retail REITs have fallen out of favour with retail investors of late – especially with the latest “circuit breaker” measures kicking in (in a bid to stop the further spread of Covid-19 in the local community), where we see retail shops providing non-essential goods and services closing from 07 April 2020 to 04 May 2020 (both dates inclusive.)
As a measure like this will negatively impact retail REITs, it is not surprising then to see some retail investors offloading these REITs from their portfolio (out of fear that the REITs may never recover from the crisis.)
However, I have a different thinking – Personally, I feel that the entire Covid-19 outbreak is just a one-off event; as soon as the virus spread is successfully contained, and the rules are eventually relaxed, we will see Singaporeans returning to the shopping malls once again, and things will go back to normal. While this is going to take some time, but I am perfectly sure that once everything goes back to normal once again, these retail REITs will once again report improving results.
As such, the recent unit price drop in retail REITs represented a golden opportunity for me to invest in them – some of them have been in my “shopping list” for quite awhile and I have recently added them to my long-term portfolio, including CapitaLand Mall Trust, Frasers Centrepoint Trust, and Mapletree Commercial Trust – and you can learn about reasons why I invested in them by clicking on their respective links.
SPH REIT (SGX:SK6U) is another retail REIT on my “shopping list” and I have added it to my long-term investment portfolio last Friday, 03 April 2020, when the REIT’s unit price fell to my intended entry price at S$0.675.
So, why did I make the investment decision? In my post today, I will be sharing with you the reasons why I invested in this retail REIT.
Let’s begin…
Brief Introduction to SPH REIT
SPH REIT was listed on the Singapore Exchange Securities Trading Limited (“SGX-ST”) on 24 July 2013, and the REIT has a total of five properties located in Singapore and in Australia (at the time of writing):
Singapore:
- Paragon
- The Clementi Mall
- The Rail Mall
Australia:
- Figtree Grove Shopping Centre (New South Wales) – acquired on 21 December 2018, and the REIT holds a 85% stake
- Westfield Marion Shopping Centre (Adelaide) – acquired on 06 December 2019, and the REIT holds a 50% stake
As at the end of the second quarter of financial year 2019/20, its properties in Singapore contributed 81% towards its overall portfolio, while its properties in Australia contributed the remaining 19%.
Historical Financial Results of SPH REIT since Post-IPO (between FY2013/14 and FY2018/19)
SPH REIT has a financial year end on 31 August. In this section, I will be sharing with you the REIT’s key financial figures since post-IPO – from FY2013/14 to FY2018/19, a total of 6 financial years:
Gross Revenue (S$’mil):
| FY 2013/14 | FY 2014/15 | FY 2015/16 | FY 2016/17 | FY 2017/18 | |
| Gross Revenue (S$’mil) | $202m | $205m | $210m | $213m | $212m |
| FY 2018/19 | |||||
| Gross Revenue (S$’mil) | $229m |
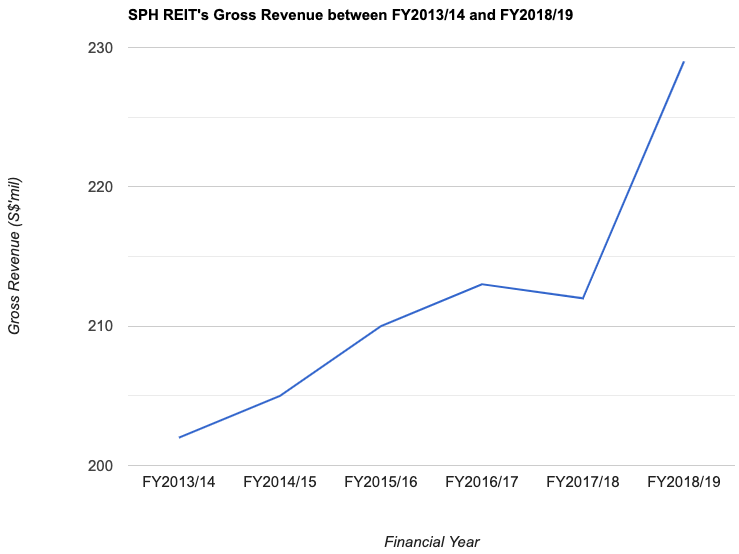
Apart from FY2017/18, where the gross revenue suffered a slight year-on-year (y-o-y) dip, all the other years saw its gross revenue recording y-o-y improvements.
The REIT’s gross revenue grew at a compound annual growth rate (CAGR) of 2.1% in 6 years.
Net Property Income (S$’mil):
| FY 2013/14 | FY 2014/15 | FY 2015/16 | FY 2016/17 | FY 2017/18 | |
| Net Property Income (S$’mil) | $151m | $156m | $161m | $168m | $166m |
| FY 2018/19 | |||||
| Net Property Income (S$’mil) | $180m |
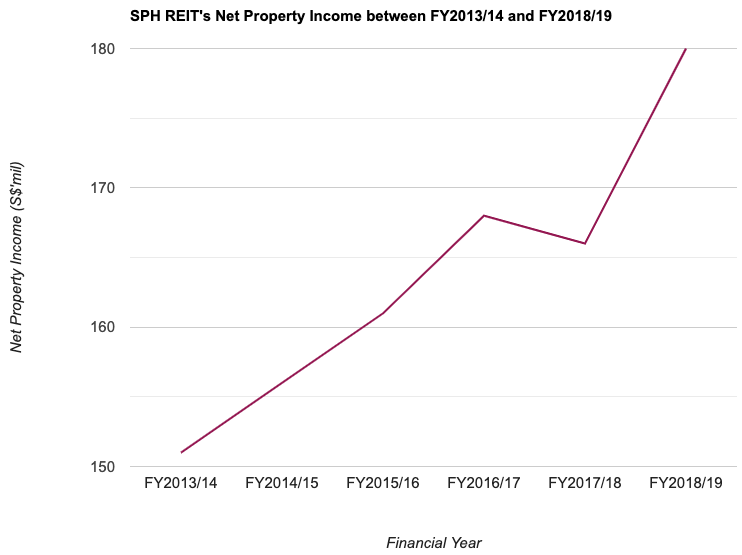
In-line with a slight dip in the REIT’s gross revenue in FY2017/18, its net property income also saw a dip in the same year. Other than that, the remaining years saw the REIT’s net property income registering y-o-y improvements.
Over a 6-year period, its net property income grew at a CAGR of 3.0%.
Distributable Income to Unitholders (S$’mil):
| FY 2013/14 | FY 2014/15 | FY 2015/16 | FY 2016/17 | FY 2017/18 | |
| Distributable Income to Unitholders (S$’mil) | $136m | $138m | $140m | $141m | $142m |
| FY 2018/19 | |||||
| Distributable Income to Unitholders (S$’mil) | $145m |
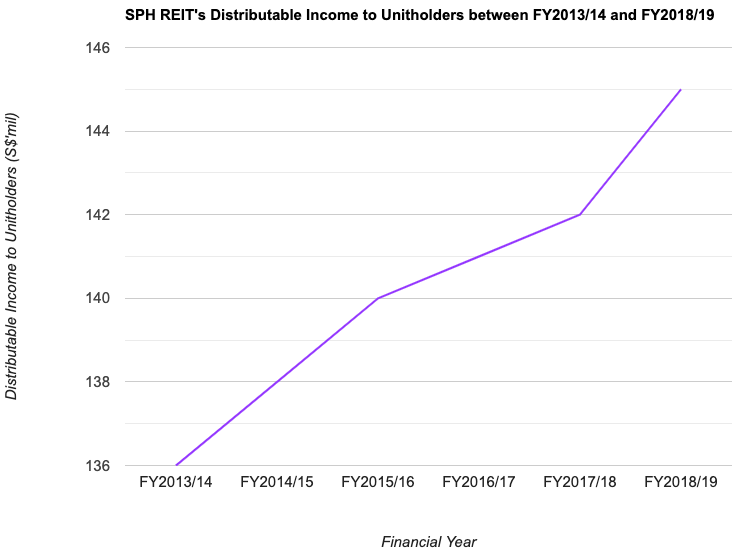
The REIT’s distributable income to unitholders saw y-o-y growth every single year since post-IPO. It grew at a CAGR of 1.1% over the past 6 years.
SPH REIT’s Financial Results in the Current Year (1H FY2019/20) Compared to the Previous Year (1H FY2018/19)
SPH REIT released its financial results for first half of the financial year 2019/20 (also known at 1H FY2019/20) last week (on 01 April 2020.) Let us take a look at its financial results, and compare them against the REIT’s results for the same period last year (i.e. 1H FY2018/19):
| 1H FY2018/19 | 1H FY2019/20 | Variance (%) | |
| Gross Revenue ($’mil) | $112m | $133m | +19.2% |
| Net Property Income (S$’mil) | $88m | $103m | +18.1% |
| Distributable Income to Unitholders (S$’mil) | $71m | $44m | -38.0% |
The y-o-y improvement in its gross revenue was mainly due to an increase in its rental income in Paragon, along with contributions from their newly acquired shopping centres in Australia – Figtree Grove Shopping Centre and Westfield Morgan Shopping Centre.
Along with an improvement in the REIT’s gross revenue, its net property income saw a y-o-y growth as well.
However, the REIT’s distributable income to unitholders was down by 38.0%, largely attributable to a 78.7% drop in distribution payout to unitholders in the latest second quarter (i.e. 2Q FY2019/20) to just 0.3 cents/unit (compared to 1.41 cents/unit in 2Q FY2018/19), in light of the challenging circumstances arising from the Covid-19 situation in the months ahead.
With regard to this, as a unitholder, I feel that we should not focus too much on the temporary drop in distributions, as this is pretty much a “one-off” event (as I have mentioned earlier on in this post), and I am confident in the management restoring the REIT’s distribution payout after the entire Covid-19 situation is over, and normal business activities resume.
SPH REIT’s Portfolio Occupancy Rate over the Past 6 Years
If you have been following my previous company writeups, you will know that one area I focus on when I study about a REIT is its portfolio occupancy profile – to find out whether or not its portfolio occupancy rate is maintained at a consistently high level, or that it has been declining over the years.
The following table is SPH REIT’s overall portfolio occupancy profile between FY2013/14 and FY2018/19, where you will find its portfolio occupancy rate, its portfolio weighted average lease expiry (WALE) by gross rental income, along with rental reversion:
| FY 2013/14 | FY 2014/15 | FY 2015/16 | FY 2016/17 | FY 2017/18 | |
| Portfolio Occupancy (%) | 100.0% | 100.0% | 100.0% | 100.0% | 99.4% |
| Portfolio WALE (years) | 2.4 years | 2.4 years | 2.2 years | 2.1 years | 2.0 years |
| Rental Reversion (%) | +8.5% | +8.6% | +5.4% | +1.2% | -3.5% |
| FY 2018/19 | |||||
| Portfolio Occupancy (%) | 99.1% | ||||
| Portfolio WALE (years) | 3.6 years | ||||
| Rental Reversion (%) | +8.4% |
Looking at SPH REIT’s portfolio occupancy profile in the table above, I am happy to note that the REIT has maintained a positive rental reversion in 5 out of 6 years.
However, I do have some concerns on its slowly declining portfolio occupancy rate – from 100.0% in FY2016/17 down to 99.1% in FY2018.19. In 1Q FY2019/20, it went up to 99.3% before dropping to 98.9% again in the latest quarter (i.e. 2Q FY2019/20) – its lowest in the last 6+ years. I will be closely monitoring its overall portfolio occupancy rate in the quarters ahead.
Debt Profile of SPH REIT between FY2013/14 and FY2018/19
Is the REIT taking on too much debt, or does it have a conservative debt profile? Let us find out in the table below:
| FY 2013/14 | FY 2014/15 | FY 2015/16 | FY 2016/17 | FY 2017/18 | |
| Gearing Ratio (%) | 26.0% | 25.7% | 25.7% | 25.4% | 26.3% |
| Average Term to Debt Maturity (%) | 4.0 years | 2.9 years | 3.1 years | 2.1 years | 2.3 years |
| Average Cost of Debt (%) | 2.3% | 2.6% | 2.8% | 2.8% | 2.9% |
| FY 2018/19 | |||||
| Gearing Ratio (%) | 27.5% | ||||
| Average Term to Debt Maturity (%) | 2.5 years | ||||
| Average Cost of Debt (%) | 2.9% |
The REIT’s gearing ratio, after falling from 26.0% in FY2013/14 to 2.5% in FY2016/17, slowly crept up again in the years thereafter, to 27.5% in FY2018/19 (which is also the highest since post-IPO), but SPH REIT has one of the lowest gearing ratios among all the Singapore-listed REITs. Also, even at its current gearing ratio, there is plenty of debt headroom for the REIT to make further yield accretive acquisitions before it hits the regulatory limit of 45.0%.
Besides the REIT’s gearing ratio, I also note that the average cost of debt have been steadily rising over the years – from a low of 2.3% in FY2013/14 to a high of 2.9% in FY2018/19. It is another area I will keep a close watch on in the coming quarters ahead.
SPH REIT’s Distribution Per Unit to Unitholders between FY2013/14 and FY2018/19
One of the reasons why I decide to invest in SPH REIT is that the REIT’s management pays out a distribution to unitholders on a quarterly basis.
Let us now take a look at the retail REIT’s distribution payout to unitholders over the past 6 years since post-IPO:
| FY 2013/14 | FY 2014/15 | FY 2015/16 | FY 2016/17 | FY 2017/18 | |
| Distribution Per Unit (S$’cents) | 5.43 cents | 5.47 cents | 5.50 cents | 5.53 cents | 5.54 cents |
| FY 2018/19 | |||||
| Distribution Per Unit (S$’cents) | 5.60 cents |
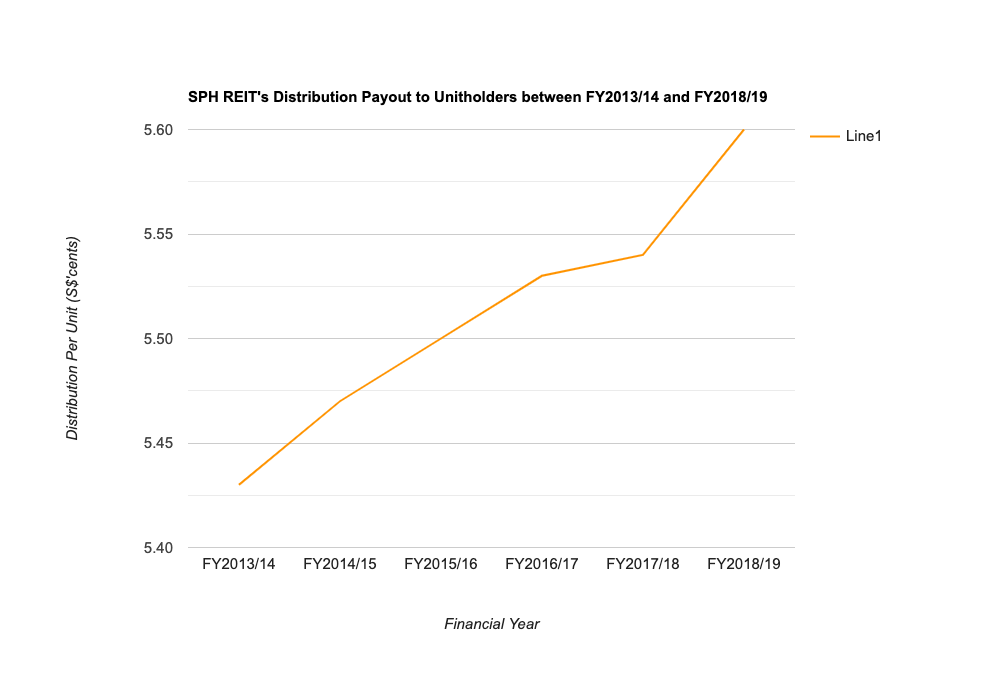
I’m happy to note that the REIT has been increasing its distribution payouts to unitholders over the past 6 years – where its distribution payout grew from 5.43 cents/unit in FY2013/14, to 5.60 cents/unit in FY2018/19, a CAGR of 0.5%.
In Conclusion
While I like the REIT for its consistent improvement in its financial results over the years, along with its rising distribution payouts to unitholders, I have some concerns about the recent dip in its portfolio occupancy rate, along with an increase in the REIT’s average cost of debt over the years – both of which I will be monitoring closely when it report their financial results in the quarters ahead.
I am not too concerned about the 78.7% quarter-on-quarter drop in its distribution payout to unitholders when they released their 2Q FY2019/20 results last week. It certainly did not affect my decision to invest in the REIT, for I am confident with the REIT’s management restoring its distribution payouts (or perhaps even rewarding unitholders for their understanding with a special distribution payout in the future) once the Covid-19 crisis is over, and everyone’s lives goes back to pre- Covid-19 period again.
With that, I have come to the end of my post, and I would like to take this opportunity to wish all my Christian readers a Happy Easter ahead, and to my non-Christian readers, a happy long weekend staying at home. 🙂
Disclaimer: At the time of writing, I am a unitholder of SPH REIT.
Stop Spending Hours Reading REIT Reports Every Quarter!
What if you could assess a REIT's portfolio occupancy, debt profile, valuation, and overall health in less than 30 seconds - without having to comb through a single quarterly report?
That's the problem the REIT Screener was built to solve.
Developed through a collaboration between ShareInvestor and The Singaporean Investor, the REIT Screener consolidates many of the key metrics and indicators I personally use when analysing REITs into one easy-to-use platform. Instead of spending hours extracting data manually every earnings season, you can now monitor the REITs you own and research new opportunities in just a few clicks.
If you're serious about REIT investing but don't have the time to manually track quarterly developments, the REIT Screener could be the shortcut you've been looking for:

Take a closer look at the REIT Screener here...


Comments (0)