Mapletree Commercial Trust (SGX:N2IU) was one of the “casualties” of the ongoing Covid-19 outbreak in Singapore, where its unit price took a huge tumble by 34% at the time of writing (it fell from its 52-week high of S$2.48 to S$1.64.)
This “blue chip REIT” had been in my “shopping list”, and a drop in its unit price of late presented a golden opportunity for me to add it to my long-term investment portfolio – which I did last Friday (03 April 2020) when the REIT’s unit price fell to my intended entry price of S$1.57.
In my post today, I will be sharing with you reasons why I’ve invested in the REIT.
Let’s get started…
Brief Introduction to Mapletree Commercial Trust
Mapletree Commercial Trust was listed on the Singapore Exchange Securities Trading Limited (“SGX-ST”) on 27 April 2011, and subsequently joining the benchmark Straits Times Index (STI) on 23 September 2019 (taking the place of Hutchison Port Holdings Trust.)
At the time of writing, the REIT’s properties in its portfolio are all located in Singapore, and they are:
- Vivocity
- Mapletree Business City
- PSA Building
- Mapletree Anson
- Bank of America Merrill Lynch Harbourfront
Historical Financial Results of Mapletree Commercial Trust between FY2011/12 and FY2018/19
One of the first things I look at before I invest in any company or REIT is to first study its historical financial results (for at least the past 5 years.)
Mapletree Commercial Trust’s financial year ends on 31 March, and in this section, I will be looking at some of the REIT’s key financial figures between FY2011/12 and FY2018/19 (a period of 8 years):
Gross Revenue (S$’mil):
| FY 2011/12 | FY 2012/13 | FY 2013/14 | FY 2014/15 | FY 2015/16 | |
| Gross Revenue (S$’mil) | $201m | $219m | $267m | $282m | $288m |
| FY 2016/17 | FY 2017/18 | FY 2018/19 | |||
| Gross Revenue (S$’mil) | $378m | $434m | $444m |

The REIT’s gross revenue over the years is, in my opinion, an impressive one, where year-on-year (y-o-y) improvements were recorded every single year over the past 8 financial years – a compound annual growth rate (CAGR) of 10.4%.
Net Property Income (S$’mil):
| FY 2011/12 | FY 2012/13 | FY 2013/14 | FY 2014/15 | FY 2015/16 | |
| Net Property Income (S$’mil) | $137m | $156m | $195m | $212m | $221m |
| FY 2016/17 | FY 2017/18 | FY 2018/19 | |||
| Net Property Income (S$’mil) | $292m | $339m | $348m |
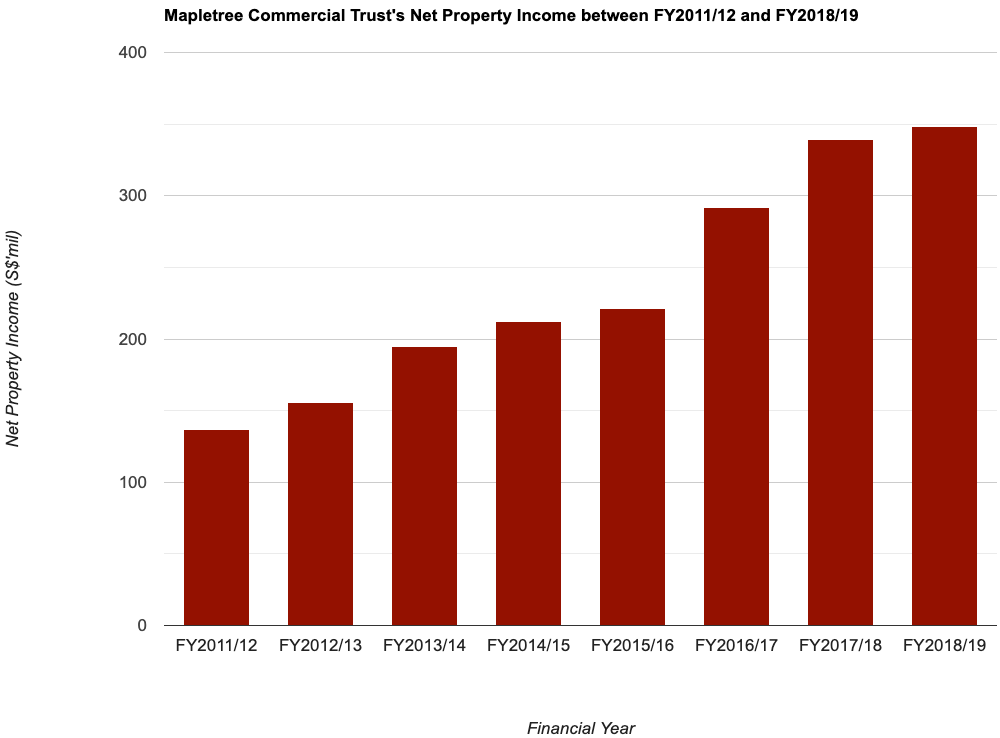
In-line with the impressive growth in its gross revenue, its net property income also saw y-o-y improvements every single year, and a CAGR of 12.4%.
Distributable Income to Unitholders (S$’mil):
| FY 2011/12 | FY 2012/13 | FY 2013/14 | FY 2014/15 | FY 2015/16 | |
| Distributable Income to Unitholders (S$’mil) | $101m | $124m | $153m | $168m | $173m |
| FY 2016/17 | FY 2017/18 | FY 2018/19 | |||
| Distributable Income to Unitholders (S$’mil) | $227m | $260m | $264m |
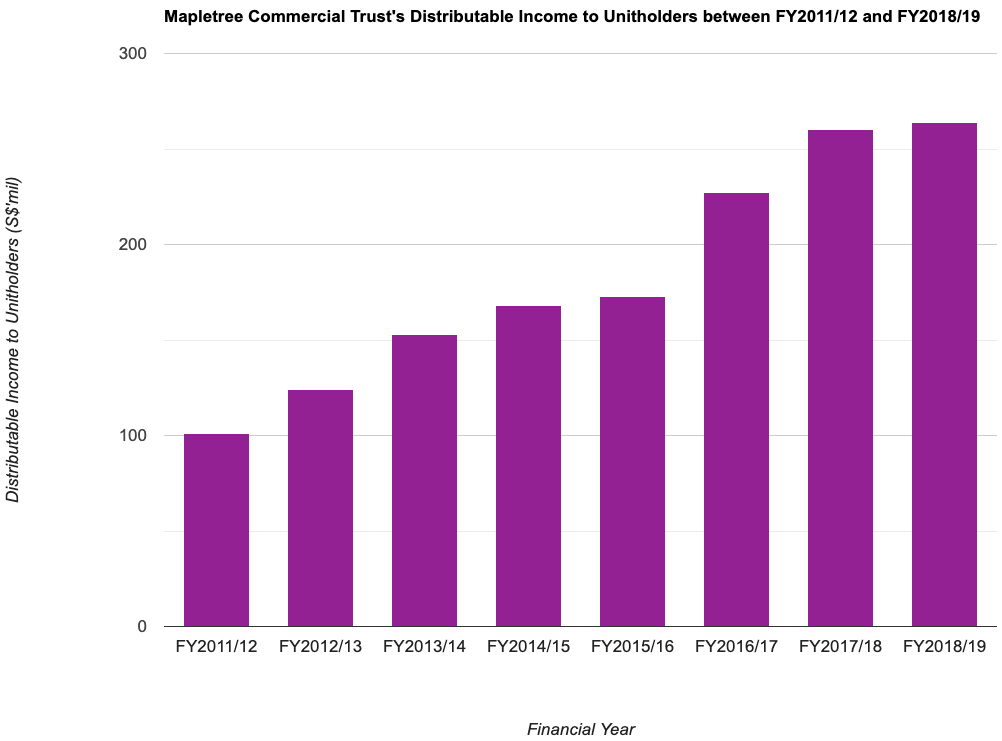
Finally, its distributable income to unitholders also grew from S$101m in FY2011/12 to S$264m in FY2018/19 – a CAGR of 12.8%. It also saw y-o-y improvements throughout the 9 financial years I have looked at.
Mapletree Commercial Trust’s Financial Performance in the First 9 Months of FY2019/2020 (vs. FY2018/19)
Mapletree Commercial Trust will be releasing their fourth quarter and full-year financial results for FY2019/20 on 22 April 2020, after trading hours. I will do a review about it when the REIT’s latest financial results are released.
Meanwhile, let us take a look at how the REIT has performed in the first 9 months of this financial year (compared to the previous financial year):
| 9M FY2018/19 | 9M FY2019/20 | Variance (%) | |
| Gross Revenue (S$’mil) | $331m | $356m | +7.4% |
| Net Property Income (S$’mil) | $260m | $279m | +7.4% |
| Distributable Income to Unitholders (S$’mil) | $197m | $213m | +8.1% |
Improvements in the REIT’s gross revenue was due to contribution from Mapletree Business City II, which acquisition was completed on 01 November 2019, along with higher contribution from all its other properties except Mapletree Anson.
With an improvement in the REIT’s gross revenue, its net property income, and also its distributable income to unitholders also saw y-o-y growth.
Mapletree Commercial Trust’s Portfolio Occupancy Profile over the Past 8 Financial Years
If what I am intending to invest in is a REIT, I will study its portfolio occupancy profile over the years to find out whether or not the REIT’s overall portfolio occupancy rate has remained consistently high, or it is showing signs of decline – I’ll be wary if it is the latter.
In the table below, you will find Mapletree Commercial Trust’s portfolio occupancy rate, as well as the portfolio weighted average leave expiry (WALE) for the past 8 financial years:
| FY 2011/12 | FY 2012/13 | FY 2013/14 | FY 2014/15 | FY 2015/16 | |
| Portfolio Occupancy Rate (%) | 94.6% | 97.7% | 98.2% | 95.7% | 96.6% |
| Portfolio WALE (years) | 2.6 years | 2.4 years | 2.0 years | 2.1 years | 2.2 years |
| FY 2016/17 | FY 2017/18 | FY 2018/19 | |||
| Portfolio Occupancy Rate (%) | 97.9% | 98.4% | 98.5% | ||
| Portfolio WALE (years) | 2.7 years | 2.7 years | 2.9 years |
Over the past 8 financial years, its portfolio occupancy rate has been maintained at above 95.0% (except for in FY2011/12, where it was slightly under 95.0%.) In the latest financial year, the REIT’s overall portfolio occupancy rate, at 98.5%, was the highest in 8 years.
In terms of the REIT’s portfolio WALE, it has also gone up from 2.0 years in FY2013/14 to 2.9 years in FY2018/19.
Debt Profile of Mapletree Commercial Trust between FY2011/12 and FY2018/19
Apart from a REIT’s financial performance and portfolio occupancy profile, another area I focus on when I study a REIT is its debt profile – in particular, I wanted to know if it has a conservative debt profile (preferred), or it has been taking on an increasing amount of debt (I tend to stay out of such REITs.)
With that, let us now take a look at Mapletree Commercial Trust’s debt profile over a 8-year period:
| FY 2011/12 | FY 2012/13 | FY 2013/14 | FY 2014/15 | FY 2015/16 | |
| Gearing Ratio (%) | 37.6% | 40.9% | 38.7% | 36.4% | 35.1% |
| Interest Coverage Ratio (times) | 5.4x | 5.3x | 5.0x | 5.3x | 5.0x |
| Average Term to Debt Maturity (years) | 2.4 years | 3.3 years | 2.5 years | 3.6 years | 3.4 years |
| Average Cost of Debt (%) | 2.0% | 2.2% | 2.2% | 2.3% | 2.5% |
| FY 2016/17 | FY 2017/18 | FY 2018/19 | |||
| Gearing Ratio (%) | 36.3% | 34.5% | 33.1% | ||
| Interest Coverage Ratio (times) | 4.9x | 4.8x | 4.5x | ||
| Average Term to Debt Maturity (years) | 4.0 years | 3.9 years | 3.6 years | ||
| Average Cost of Debt (%) | 2.7% | 2.8% | 3.0% |
Since FY2012/13, when its gearing ratio went up to 40.9%, it has gradually come down over the years, and in FY2018/19, it is at 33.1% – which is a safe distance away from the regulatory limit of 45.0%, hence allowing the REIT ample of debt headroom to make further yield accretive acquisitions when an opportunity to do so arises.
If there’s one thing that I do not quite like about the REIT, it is the average cost of debt – as you can see from the table above, it has gone up over the years – from 2.0% in FY2011/12 to a high of 3.0% in FY2018/19. Looking at its average cost of debt at the end of the third quarter of FY2019/20 (ended 31 December 2019), it remains at 3.0%. I will be keeping a close watch on this in the coming quarters ahead.
Mapletree Commercial Trust’s Distribution Per Unit to Unitholders between FY2011/12 and FY2018/19
When it comes to dividend payouts (it is known as distribution payouts in a REIT), my preference is towards companies/REITs that declares a payout to shareholders (for REITs, it is known as unitholders) on a quarterly basis.
Mapletree Commercial Trust’s management declares a distribution to unitholders on a quarterly basis (and this is one of the reasons why I’ve invested in the REIT), and in the table below, you’ll find its distribution per unit over the past 8 financial years:
| FY 2011/12 | FY 2012/13 | FY 2013/14 | FY 2014/15 | FY 2015/16 | |
| Distribution Per Unit (S$’cents) | 5.3 cents | 6.5 cents | 7.4 cents | 8.0 cents | 8.1 cents |
| FY 2016/17 | FY 2017/18 | FY 2018/19 | |||
| Distribution Per Unit (S$’cents) | 8.6 cents | 9.0 cents | 9.1 cents |
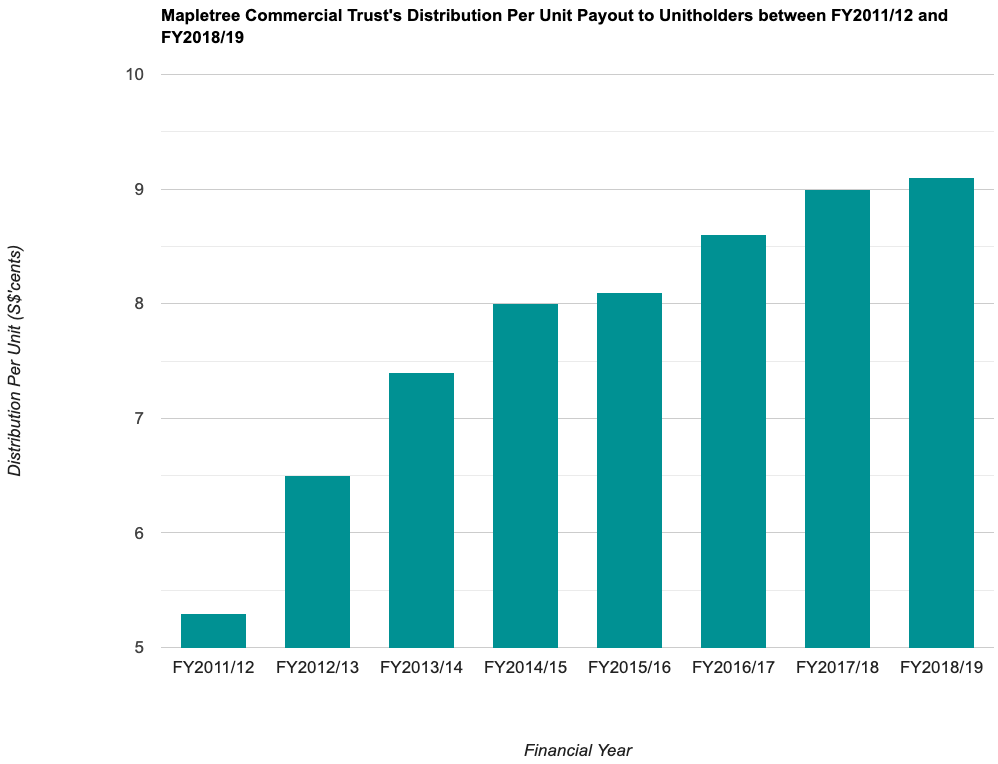
As you can see from the table above, Mapletree Commercial Trust’s distribution per unit have gone up every single financial year – from 5.3 cents/unit in FY2011/12 to 9.1 cents/unit in FY2018/19 – a CAGR of 7.0%. This is something I like about the REIT as well.
In Conclusion
Its solid financial results, portfolio occupancy profile, and a conservative debt profile, along with its increasing distribution payouts over the years are reasons why I invested in the REIT. The only concern I have is the increasing average cost of debt over the years, which I will be monitoring in the quarters ahead.
I am fully aware that the REIT’s financial results and distribution payouts in the near-term is likely to be adversely impacted due to the ongoing Covid-19 outbreak in Singapore. That said, in my opinion, this is just a one-off event which, upon businesses resuming their normal operations, it will eventually bounce back.
Also, let’s not forget about the government’s plan to develop the Greater Southern Waterfront (and all but one of Mapletree Commercial Trust’s properties are located in the vicinity), along with plans to upgrade Resorts World Sentosa. Upon the project completions in the year 2027, Mapletree Commercial Trust’s properties will benefit from it – in terms of increased footfall in Vivocity, and also a possible increase in demand in the REIT’s office spaces (which may result in an increase in rental reversion.)
All in all, I am confident of the REIT reporting improving sets of results in the years ahead (after the Covid-19 crisis is over), and I am sure that distribution payouts to us unitholders will continue to record increases as well.
Before I end today’s post, I’d like to remind you to stay at home during this “circuit breaker” period. As long as each and every one of us play our part to stay at home, we can control the further spread of Covid-19, and in so doing, we can expect the current “circuit breaker” measures to be lifted, or at least be relaxed significantly when the one month period is up on 04 May 2020.
Please take good care of yourself and stay safe… 😀
Disclaimer: At the time of writing, I am a unitholder of Mapletree Commercial Trust.
Stop Spending Hours Reading REIT Reports Every Quarter!
What if you could assess a REIT's portfolio occupancy, debt profile, valuation, and overall health in less than 30 seconds - without having to comb through a single quarterly report?
That's the problem the REIT Screener was built to solve.
Developed through a collaboration between ShareInvestor and The Singaporean Investor, the REIT Screener consolidates many of the key metrics and indicators I personally use when analysing REITs into one easy-to-use platform. Instead of spending hours extracting data manually every earnings season, you can now monitor the REITs you own and research new opportunities in just a few clicks.
If you're serious about REIT investing but don't have the time to manually track quarterly developments, the REIT Screener could be the shortcut you've been looking for:

Take a closer look at the REIT Screener here...


Comments (2)