Last Thursday (02 April 2020), when the unit price of Frasers Centrepoint Trust (SGX:J69U) hit my intended entry price of S$1.85, I’ve added the retail REIT to my long-term investment portfolio.
Based on a total distribution payout of 12.07 Singapore cents/unit in FY2018/19, the yield is 6.5%. No doubt in the near-term, the REIT’s distribution may take a hit due to the ongoing Covid-19 outbreak (which badly affected the retail sector), I am confident of the yield recovering (and even increasing with time) once the outbreak ends, and normal business activities resume.
With that, in my writeup today, I’ll be sharing with you reasons why I’ve made the investment decision to add the REIT to my long-term investment portfolio.
Let’s get started…
A Brief Introduction about Frasers Centrepoint Trust
Frasers Centrepoint Trust’s portfolio consists of retail malls located in the heartland. At the time of writing, the retail malls under the REIT’s portfolio include (listed in alphabetical order):
- Anchorpoint
- Bedok Point
- Changi City Point
- Northpoint City North Wing
- Waterway Point
- YewTee Point
Besides the malls above, Frasers Centrepoint Trust also have stakes in the following:
- 31.15% of the units in Hektar REIT listed in the Main Market of Bursa Malaysia Securities Berhad. Its portfolio comprises Subang Parade (Selangor), Mahkota Parade (Malacca), Wetex Parade (Johor), Central Square (Kedah), Landmark Central (Kedah), and Segamat Central (Johor)
- 21.13% stake in PGIM Real Estate AsiaRetail Fund Limited. Its portfolio comprises 5 retail malls (Tiong Bahru Plaza, White Sands, Hougang Mall, Century Square, and Tampines 1), 1 office property (Central Plaza), and 2 retail malls in Malaysia
Frasers Centrepoint Trust’s Historical Financial Results over a 10-Year Period (between FY2009/10 and FY2018/19)
Frasers Centrepoint Trust’s financial year ends on 30 September. In this section, let us take a look at the retail REIT’s key financial results over a 10-year period.
Gross Revenue (S$’mil):
| FY 2009/10 | FY 2010/11 | FY 2011/12 | FY 2012/13 | FY 2013/14 | |
| Gross Revenue (S$’mil) | $115m | $118m | $147m | $158m | $169m |
| FY 2014/15 | FY 2015/16 | FY 2016/17 | FY 2017/18 | FY 2018/19 | |
| Gross Revenue (S$’mil) | $189m | $184m | $182m | $193m | $196m |
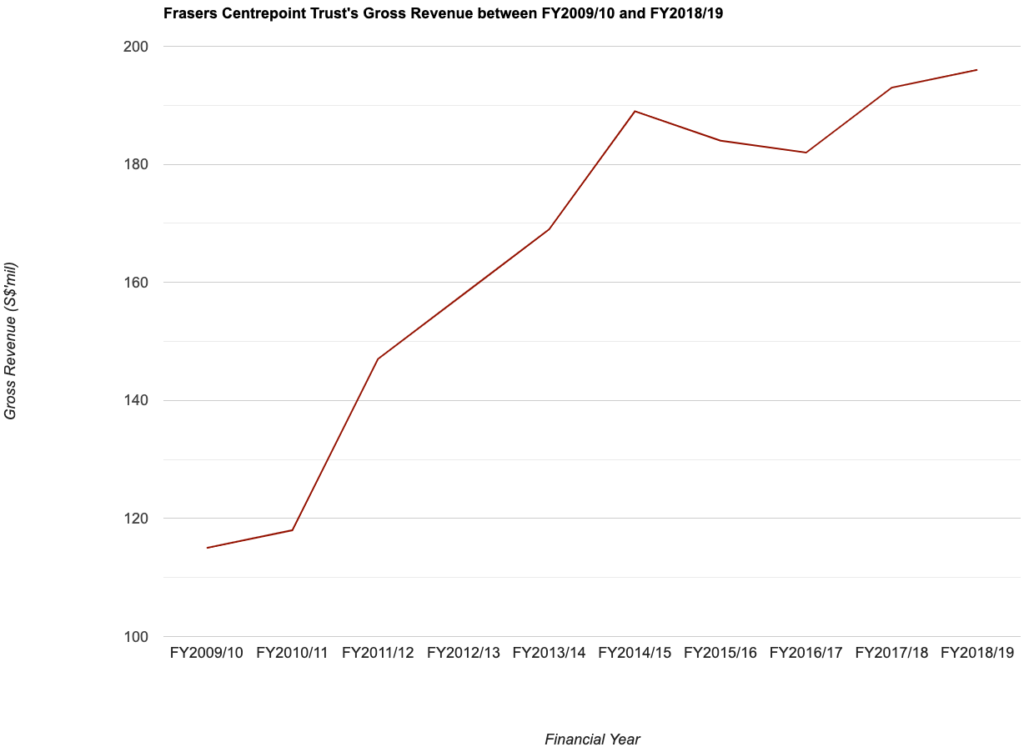
Other than in FY2015/16 and FY2016/17, due to planned vacancies in conjunction with asset enhancement initiatives (AEI) works in Northpoint City North Wing, all the other years saw year-on-year (y-o-y) improvements to its gross revenue.
Over a 10-year period, the REIT’s gross revenue grew at a compound annual growth rate of 5.5%.
Net Property Income (S$’mil):
| FY 2009/10 | FY 2010/11 | FY 2011/12 | FY 2012/13 | FY 2013/14 | |
| Net Property Income (S$’mil) | $80m | $83m | $104m | $112m | $118m |
| FY 2014/15 | FY 2015/16 | FY 2016/17 | FY 2017/18 | FY 2018/19 | |
| Net Property Income (S$’mil) | $131m | $130m | $130m | $137m | $139m |

In-line with a year-on-year drop in its gross revenue in FY2015/16 and FY2016/17, its net property income suffered slight declines as well. The other years saw the retail REIT’s net property income recording y-o-y improvements.
Over a 10-year period, the REIT’s net property income grew at a CAGR of 5.7%.
Distributable Income to Unitholders (S$’mil):
| FY 2009/10 | FY 2010/11 | FY 2011/12 | FY 2012/13 | FY 2013/14 | |
| Distributable Income to Unitholders (S$’mil) | $59m | $64m | $82m | $90m | $95m |
| FY 2014/15 | FY 2015/16 | FY 2016/17 | FY 2017/18 | FY 2018/19 | |
| Distributable Income to Unitholders (S$’mil) | $106m | $108m | $110m | $111m | $120m |

Frasers Centrepoint Trust’s distributable income to unitholders over a 10-year period saw y-o-y growth every single year – from S$59m in FY2009/10 to S$120m in FY2018/19 – a CAGR of 7.4%.
Frasers Centrepoint Trust’s Occupancy Rate between FY2009/10 and FY2018/19
One of the things I look at when I study a REIT is the portfolio occupancy profile.
In the table below, I’ve compiled the REIT’s portfolio occupancy rate, its weighted average lease expiry by gross rent (or WALE in short), along with its rental reversion over a 10-year period:
| FY 2009/10 | FY 2010/11 | FY 2011/12 | FY 2012/13 | FY 2013/14 | |
| Portfolio Occupancy (%) | 98.1% | 95.1% | 93.6% | 98.4% | 98.9% |
| WALE (years) | 1.3 years | 1.8 years | 1.8 years | 1.5 years | 1.4 years |
| Rental Reversion (%) | +7.2% | +7.9% | +12.1% | +7.7% | +6.5% |
| FY 2014/15 | FY 2015/16 | FY 2016/17 | FY 2017/18 | FY 2018/19 | |
| Portfolio Occupancy (%) | 96.0% | 89.4% | 92.0% | 94.7% | 96.5% |
| WALE (years) | 1.5 years | 1.4 years | 1.7 years | 1.7 years | 1.6 years |
| Rental Reversion (%) | +6.3% | +9.9% | +5.1% | +3.2% | +4.8% |
Except in FY2015/16, due to planned vacancies for AEI works to be carried out in Northpoint City North Wing which led to the REIT’s overall portfolio occupancy rates to fall slightly under 90.0%, all the other years saw its occupancy rate recording at above 90.0%.
The REIT’s WALE has also been maintained at a consistent rate over a 10-year period.
Finally, I am pleased to note that the REIT has also recorded a positive rental reversion every year throughout the entire 10-year period I have looked at.
Debt Profile of Frasers Centrepoint Trust over a 10-Year Period
Before I add any REIT to my long-term investment portfolio, I will first make sure that it does not take on too much debt, and that the REIT’s gearing ratio is some distance away from the regulatory limit of 45.0% (this is so that the REIT is able to make further yield accretive acquisitions should a good opportunity comes along.)
The following table is Frasers Centrepoint Trust’s debt profile between FY2009/10 and FY2018/19:
| FY 2009/10 | FY 2010/11 | FY 2011/12 | FY 2012/13 | FY 2013/14 | |
| Gearing Ratio (%) | 30.3% | 31.3% | 30.1% | 27.6% | 29.4% |
| Interest Coverage Ratio (times) | 4.4x | 4.6x | 5.6x | 6.2x | 6.2x |
| Average Cost of Debt (%) | 3.8% | 3.0% | 2.7% | 2.5% | 2.4% |
| FY 2014/15 | FY 2015/16 | FY 2016/17 | FY 2017/18 | FY 2018/19 | |
| Gearing Ratio (%) | 28.2% | 28.3% | 29.0% | 28.6% | 32.9% |
| Interest Coverage Ratio (times) | 6.6x | 7.4x | 6.9x | 6.3x | 4.5x |
| Average Cost of Debt (%) | 2.4% | 2.1% | 2.3% | 2.6% | 2.6% |
From the REIT’s 10-year debt profile above, it seems to me that, as far as possible, it tries to keep the gearing ratio at under 30.0% (it has managed to do so in 6 out of 10 years.) This is something I like, as it gives the REIT ample debt headroom to make further yield accretive acquisitions when an opportunity arises.
Also, I like the REIT’s average cost of debt in that over the years, it has gradually come down from 3+% to 2+%.
Distribution Per Unit to Unitholders over a 10-Year Period (between FY2009/10 and FY2018/19)
I prefer to invest in REITs that declare a distribution payout to unitholders on a quarterly basis – Frasers Centrepoint Trust fulfils this criteria of mine.
So, how has the retail REIT been rewarding its unitholders over the years? Let us take a look in the table below:
| FY 2009/10 | FY 2010/11 | FY 2011/12 | FY 2012/13 | FY 2013/14 | |
| Distribution Per Unit (S$’cents) | 8.20 cents | 8.32 cents | 10.01 cents | 10.93 cents | 11.19 cents |
| FY 2014/15 | FY 2015/16 | FY 2016/17 | FY 2017/18 | FY 2018/19 | |
| Distribution Per Unit (S$’cents) | 11.61 cents | 11.76 cents | 11.90 cents | 12.02 cents | 12.07 cents |

As you can see from the above, Frasers Centrepoint Trust have been increasing its distribution payout to unitholders every single year over the past 10-years – its distribution per unit have grown from 8.20 cents/unit in FY2009/10 to 12.07 cents/unit in FY2018/19 – a CAGR of 3.9%.
In Conclusion
I think its clear from the sections above why I made the decision to invest in the REIT – I am impressed with how the REIT have managed to record growth in its financial results and distribution payouts over the years, and also the fact that it has managed to record a positive rental reversion every single year, and that it has a really conservative debt profile.
No doubt the REIT may be negatively impacted by the most recent “circuit breaker” measures announced by Singapore’s Prime Minister Lee Hsien Loong last Friday (03 April 2020) in the near-term, but I am confident of its eventual recovery once this Covid-19 situation comes to an end.
Before I end today’s post, one gentle reminder – today is the first day of the one month “circuit breaker” period (from 07 April to 04 May, both days inclusive.) I’d like to appeal to each and every one of you to stay at home as much as possible – go out only when its absolutely necessary (such as to the wet or supermarket to replenish your fresh food and groceries, or to order takeaways.) Together, we can help to stem the further spread of Covid-19 in Singapore, and that the “circuit breaker” period need not be extended after the month is up.
Disclaimer: At the time of writing, I am a unitholder of Frasers Centrepoint Trust.
Stop Spending Hours Reading REIT Reports Every Quarter!
What if you could assess a REIT's portfolio occupancy, debt profile, valuation, and overall health in less than 30 seconds - without having to comb through a single quarterly report?
That's the problem the REIT Screener was built to solve.
Developed through a collaboration between ShareInvestor and The Singaporean Investor, the REIT Screener consolidates many of the key metrics and indicators I personally use when analysing REITs into one easy-to-use platform. Instead of spending hours extracting data manually every earnings season, you can now monitor the REITs you own and research new opportunities in just a few clicks.
If you're serious about REIT investing but don't have the time to manually track quarterly developments, the REIT Screener could be the shortcut you've been looking for:

Take a closer look at the REIT Screener here...


Comments (2)