Those who I have been communicating with on a regular basis on InvestingNote or privately on Telegram will know that my target price to invest in DBS Group Holdings (SGX:D05) was S$24.00 (based on the upcoming annualised dividend payout of S$1.32/share in FY2020, the yield will be 5.5%.) Hence, when the entry price came on 04 March 2020, I’ve added the bank to my long-term investment portfolio.
At the time of writing this post, the bank’s share price is trading at S$18.72, a 22.0% drop from my initial investment price.
That said, I am not panicking, and will remain invested in the bank because I am confident of its share price bouncing back up when the Covid-19 situation comes to an end, and normal business activities resumes. In fact, I am even prepared to increase my investments in the bank should the share price goes down further.
In this post, I’ll be sharing with you reasons why I’ve added the bank to my long-term investment portfolio. But first up, a brief introduction about the bank:
A Brief Introduction about DBS Group Holdings
If you are a Singaporean, most likely you will have a bank account with either POSB or DBS (I have my bank account with the bank when I was 7 – as all Primary One school goers had to open a savings account with the bank.)
Other than in Singapore, do you know that DBS also have operations in 18 markets globally, including 6 priority markets in Asia (apart from Singapore, the bank also has a presence in Hong Kong, China, India, Indonesia, and Taiwan.)
In 2019, DBS became the first bank in the world to hold 3 of the most prestigious global bank awards at the same time – they are “World’s Best Bank 2019” by Euromoney, “Bank of the Year 2018” by The Banker, and “Best Bank in the World 2018” by Global Finance.
Historical Financial Performance of DBS between FY2010 and FY2019
Before I make any investment decisions, I will first make sure I gain a good knowledge of any company I want to invest my money in.
One of the first things I look at is a company’s financial performances over the years (at least 5), and in this section, I will be sharing with you some of the key financial statistics of DBS over a period of 10 years – between FY2010 and FY2019:
Net Interest Income, Net Fee & Commission Income, and Other Non-Interest Income:
The bank’s total income comprises of 3 components: (i) Net Interest Income, (ii) Net Fee & Commission Income, and (iii) Other Non-Interest Income:
| FY2010 | FY2011 | FY2012 | FY2013 | FY2014 | |
| Net Interest Income (S$’mil) | $4,318m | $4,825m | $5,285m | $5,569m | $6,321m |
| Net Fee & Commission Income (S$’mil) | $1,397m | $1,542m | $1,579m | $1,885m | $2,027m |
| Other Non- Interest Income (S$’mil) | $1,351m | $1,264m | $1,200m | $1,473m | $1,270m |
| FY2015 | FY2016 | FY2017 | FY2018 | FY2019 | |
| Net Interest Income (S$’mil) | $7,100m | $7,305m | $7,791m | $8,955m | $9,625m |
| Net Fee & Commission Income (S$’mil) | $2,144m | $2,331m | $2,622m | $2,780m | $3,052m |
| Other Non- Interest Income (S$’mil) | $1,557m | $1,853m | $1,511m | $1,448m | $1,867m |

Over a 10-year period, both the bank’s net interest income, as well as its net fee and commission income recorded improvements every single year.
The only one that have inconsistent growth is its “other non-interest income”, where it suffered year-on-year (y-o-y) declines in 5 out of 10 years due to the following reasons:
- FY2011: Due to lower trading gains
- FY2012: Due to lower net income from financial investments, and also gains from a transaction to combine DBS Asset Management with Nikko Asset Management in recorded in FY2011
- FY2014: Due to a decline in net trading income
- FY2017: Due to a decline in trading income, and also gains from fixed assets recorded in the previous year
- FY2018: Due to a decline in net income from investment securities
Despite of that, all 3 business components managed to report a compound annual growth rate (CAGR) of:
- Net Interest Income: 8.4%
- Net Fee & Commission Income: 8.1%
- Other Non-Interest Income: 3.3%
over a period of 10 financial years – between FY2010 and FY2019.
Net Profit Attributable to Shareholders:
| FY2010 | FY2011 | FY2012 | FY2013 | FY2014 | |
| Net Profit Attributable to Shareholders (S$’mil) | $1,632m | $3,035m | $3,809m | $3,672m | $4,046m |
| FY2015 | FY2016 | FY2017 | FY2018 | FY2019 | |
| Net Profit Attributable to Shareholders (S$’mil) | $4,454m | $4,238m | $4,371m | $5,577m | $6,391m |
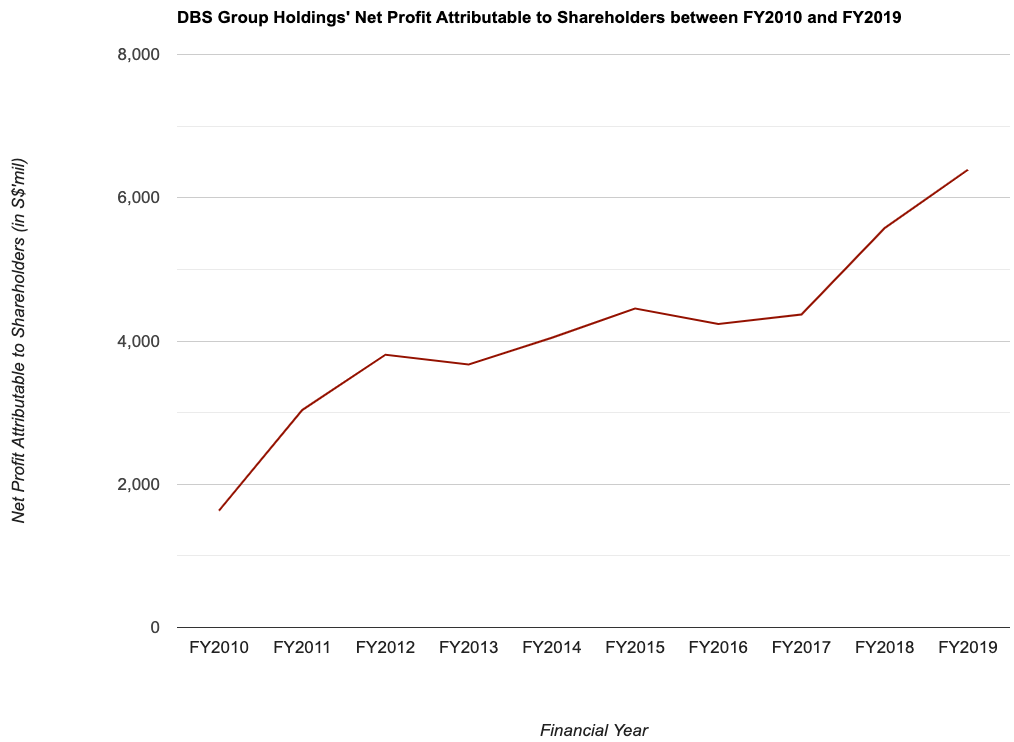
Other than dips in 2 years, all the remaining years saw the bank’s net profit attributable to shareholders improving on a y-o-y basis. More impressively, it has grown at a CAGR of 14.6% over a 10-year period.
Return on Equity:
Return on Equity, or RoE, in layman terms, is a measure of profitability for every dollar of shareholders’ money a company uses in its businesses.
For example, if a company’s RoE is 15.0%, it means the company is able to generate a $15 profit for every $100 of shareholders’ money it uses.
With that, let us now take a look at DBS’ RoE between FY2010 and FY2019:
| FY2010 | FY2011 | FY2012 | FY2013 | FY2014 | |
| Return on Equity (%) | 10.2% | 11.0% | 11.2% | 10.8% | 10.9% |
| FY2015 | FY2016 | FY2017 | FY2018 | FY2019 | |
| Return on Equity (%) | 11.2% | 10.1% | 9.7% | 12.1% | 13.2% |
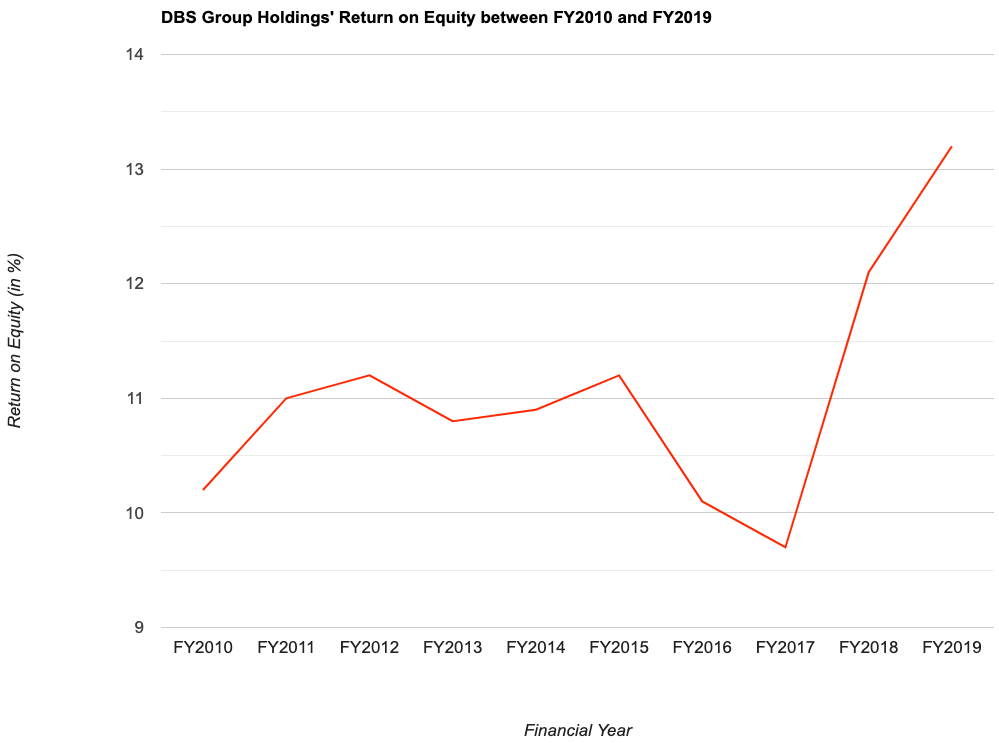
For most years, DBS’ RoE has been hoovering between 10.2% and 11.2%, but since it reached a low of 9.7% in FY2017, it has rebounded strongly the following year, to hit a record high in FY2018 (at 12.1%), and another new high in FY2019 (at 13.2%.)
Dividend Payout to Shareholders over a Period of 10 Years (between FY2010 and FY2019)
From twice a year payout to shareholders, the management have changed its dividend payout to shareholders on a quarterly basis since FY2019.
In the table below, you’ll find DBS’ dividend payout to shareholders, along with the payout ratio over a 10-year period:
| FY2010 | FY2011 | FY2012 | FY2013 | FY2014 | |
| Dividend Per Share (S$’cents) | 56.0 cents | 56.0 cents | 56.0 cents | 58.0 cents | 58.0 cents |
| Dividend Payout Ratio (%) | 44.4% | 82.4% | 35.9% | 39.2% | 36.0% |
| FY2015 | FY2016 | FY2017 | FY2018 | FY2019 | |
| Dividend Per Share (S$’cents) | 60.0 cents | 60.0 cents | 143.0 cents | 120.0 cents | 123.0 cents |
| Dividend Payout Ratio (%) | 33.9% | 36.1% | 84.6% | 55.6% | 50.0% |
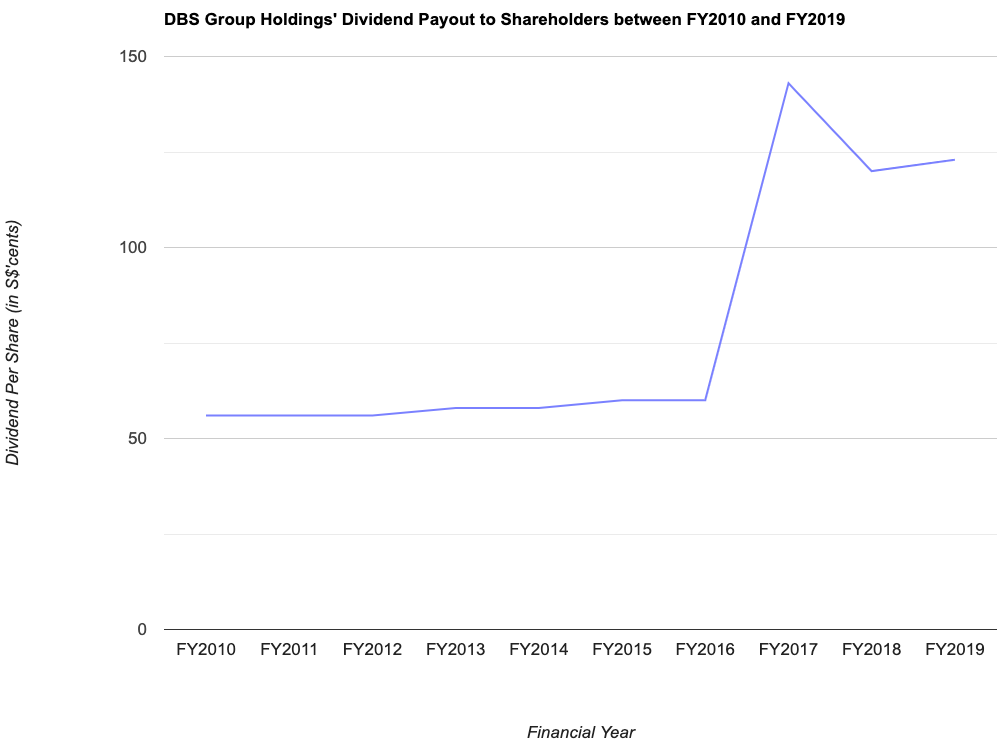
Stripping out the special dividend of 50.0 cents/share declared in FY2017, you’ll notice that, over the years, DBS have gradually increased its dividend payout to shareholders over the years – where its payout increased from 56.0 cents/share in FY2010 to 123.0 cents/share in FY2019, a CAGR of 8.2%.
Looking at the bank’s dividend payout ratio over the years, in my personal opinion, the bank should have no problem to further increase its dividend payout to shareholders if it wishes to do so – speaking of which, I’ve also mentioned in the beginning of the post that, barring unforeseen circumstances, the bank will be increasing their dividend payout to shareholders to S$1.32/share in FY2020 (meaning a payout of 33.0 cent/share every quarter.)
In Conclusion
I’m sure that, after reading through the post from start to finish, you will agree with me that DBS’ financial results over the years is rock solid, and the bank certainly makes a great investment in anyone’s long-term investment portfolio.
This is exactly the reason why I have invested in the bank, and will continue to hold onto my shares for the long-term, as I am confident of its growth in the years to come.
Disclaimer: At the time of writing, I am a shareholder of DBS Group Holdings.
Are You Worried about Not Having Enough Money for Retirement?
You're not alone. According to the OCBC Financial Wellness Index, only 62% of people in their 20s and 56% of people in their 30s are confident that they will have enough money to retire.
But there is still time to take action. One way to ensure that you have a comfortable retirement is to invest in real estate investment trusts (REITs).
In 'Building Your REIT-irement Portfolio' which I've authored, you will learn everything you need to know to build a successful REIT investment portfolio, including a list of 9 things to look at to determine whether a REIT is worthy of your investment, 1 simple method to help you maximise your returns from your REIT investment, 4 signs of 'red flags' to look out for and what you can do as a shareholder, and more!

You can find out more about the book, and grab your copy (ebook or physical book) here...


Comments (2)