Great sell-downs like this offers long-term investors a golden opportunity to either invest, or add on to their shareholdings, in rock solid companies at basement prices.
Being a long-term investor myself, I am always on a lookout for opportunities like this, and on 28 February 2020, I have added the retail REIT CapitaLand Mall Trust (SGX:C38U) in my long-term investment portfolio.
In my post today, I’d be sharing with you my reasons for this investment…
A Brief Introduction to CapitaLand Mall Trust
Most of us Singaporeans should be familiar with the REIT (as we frequent many of the REIT’s managed retail malls.) So, allow me to just do a very quick introduction about the REIT (for the benefit of the minority who may be hearing about this REIT for the very first time.)
At the end of financial year 2019 on 31 December 2019, the retail REIT’s portfolio consists of a total of 15 malls, most of them in close proximity to the MRT stations, which allows for easy access. The malls under the REIT’s portfolio are:
- Tampines Mall
- Junction 8
- Funan (re-opened in June 2020 after closing for 3 years for re-development)
- IMM building (retail leases only)
- Plaza Singapura
- Bugis Junction
- Raffles City Singapore
- Lot One Shoppers’ Mall
- The Atrium Orchard (includes retail and office leases)
- Clarke Quay
- Bugis+
- Westgate
- Bedok Mall
- JCube
- Bukit Panjang Plaza
Announcement of a Proposed Merger with CapitaLand Commercial Trust (SGX:C61U)
A proposed merger with CapitaLand Commercial Trust (SGX:C61U) was announced on 22 January 2020.
To summarise, CapitaLand Mall Trust will be offering unitholders of CapitaLand Commercial Trust, for every unit of the REIT they have, 0.720 units of CapitaLand Mall Trust, plus S$0.2590 in cash.
Upon approval and completion of the merger, the REIT will be renamed to CapitaLand Integrated Commercial Trust (CICT). In terms of its portfolio, on top of the 15 retail malls, upon completion of the proposed merger, the enlarged REIT’s portfolio will have an addition of 10 prime office assets – 8 of them in Singapore, and the remaining 2 in Germany.
The enlarged REIT is also expected to be the largest REIT in Singapore, and also the third largest REIT in APAC. This will definitely help boost trading liquidity, along with the potential for a positive re-rating in the future.
Subject to the necessary approvals to be sought, the proposed merger is expected to be completed by the end of 2Q FY2020.
My thoughts: Even after the merger, the REIT’s properties are still geographically concentrated in Singapore (at 96%). However, I am confident of the REIT’s ability to record continuous growth in the years ahead.
Historical Financial Results of CapitaLand Mall Trust between FY2010 and FY2019
If you have been following my posts, you’ll know that one of my selection criteria for companies to add to my long-term investment portfolio is that they must display growth in both its top- and bottom-line over the years.
Having said that, the table below is CapitaLand Mall Trust’s top- and bottom-line growth over a 10-year period (between FY2010 and FY2019):
| FY2010 | FY2011 | FY2012 | FY2013 | FY2014 | |
| Gross Revenue (S$’mil) | $581m | $631m | $662m | $638m | $659m |
| Net Property Income (S$’mil) | $399m | $418m | $445m | $439m | $448m |
| Distributable Income to Unitholders (S$’mil) | $305m | $297m | $317m | $356m | $375m |
| FY2015 | FY2016 | FY2017 | FY2018 | FY2019 | |
| Gross Revenue (S$’mil) | $669m | $690m | $682m | $698m | $787m |
| Net Property Income (S$’mil) | $466m | $480m | $478m | $494m | $558m |
| Distributable Income to Unitholders (S$’mil) | $392m | $394m | $396m | $411m | $442m |
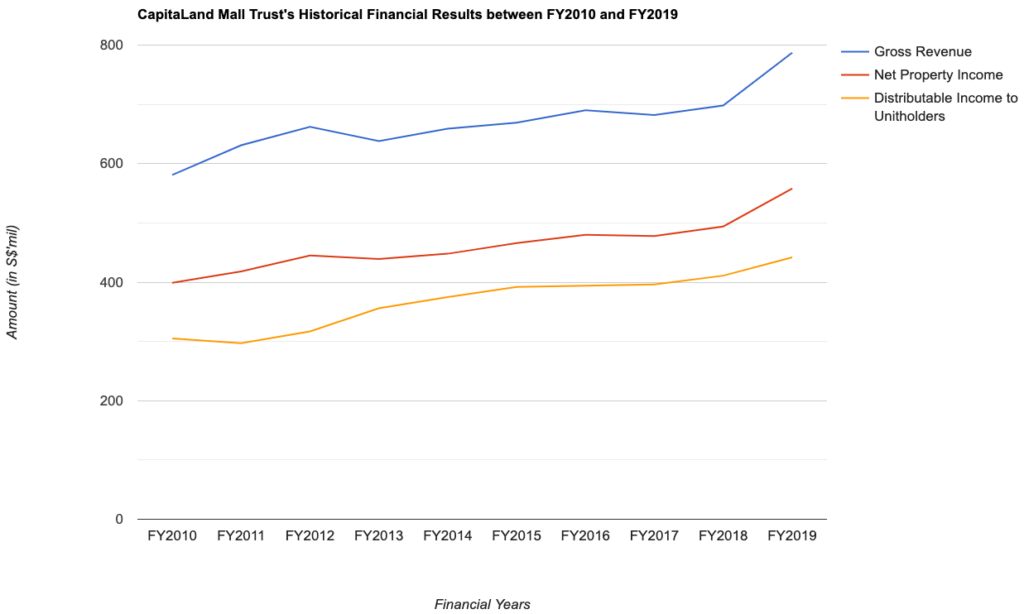
Gross Revenue: Over a 10-year period, its gross revenue saw a compound annual growth rate (CAGR) of 3.1%, with year-on-year (y-o-y) improvements recorded every single years, except for slight declines recorded in FY2013 and FY2017
Net Property Income: In-line with slight drops in FY2013 and FY2017, CapitaLand Mall Trust’s net property income was also down on a y-o-y basis for the 2 years. Other than that, all other years saw y-o-y improvements. Over a 10-year period, the retail REIT’s net property income grew at a CAGR of 3.4%.
Distributable Income to Unitholders: Unitholders were rewarded for the REIT’s improving performances, where over a period of 10-years, its distributable income to unitholders grew at a CAGR of 3.8%. Apart from FY2011, all the other years saw y-o-y improvements
My Thoughts: This is one of the reasons why I invested in the REIT – for its improving financial results over the years. I am confident of further improvements ahead, especially after the REIT’s merger with CapitaLand Commercial Trust.
CapitaLand Mall Trust’s Portfolio Occupancy Profile over a 10-Year Period
If the company is a REIT, I will also study its portfolio occupancy profile to find out its overall portfolio occupancy rate for all its properties under its portfolio (to make sure that over the years, its occupancy rate is not on a declining trend), and also its rental reversion (my preference is to see a REIT being able to maintain a positive rental reversion over the years – meaning the REIT is able to secure an increase in rental upon lease renewals with tenants.)
Let us now have a look at CapitaLand Mall Trust’s portfolio occupancy profile between FY2010 and FY2019:
| FY2010 | FY2011 | FY2012 | FY2013 | FY2014 | |
| Portfolio Occupancy (%) | 99.3% | 94.8% | 98.2% | 98.5% | 98.8% |
| Rental Reversion (%) | +6.5% | +6.4% | +6.0% | +6.3% | +6.1% |
| FY2015 | FY2016 | FY2017 | FY2018 | FY2019 | |
| Portfolio Occupancy (%) | 97.6% | 98.5% | 99.2% | 99.2% | 99.3% |
| Rental Reversion (%) | +3.7% | +1.0% | +1.7% | +0.7% | +0.8% |
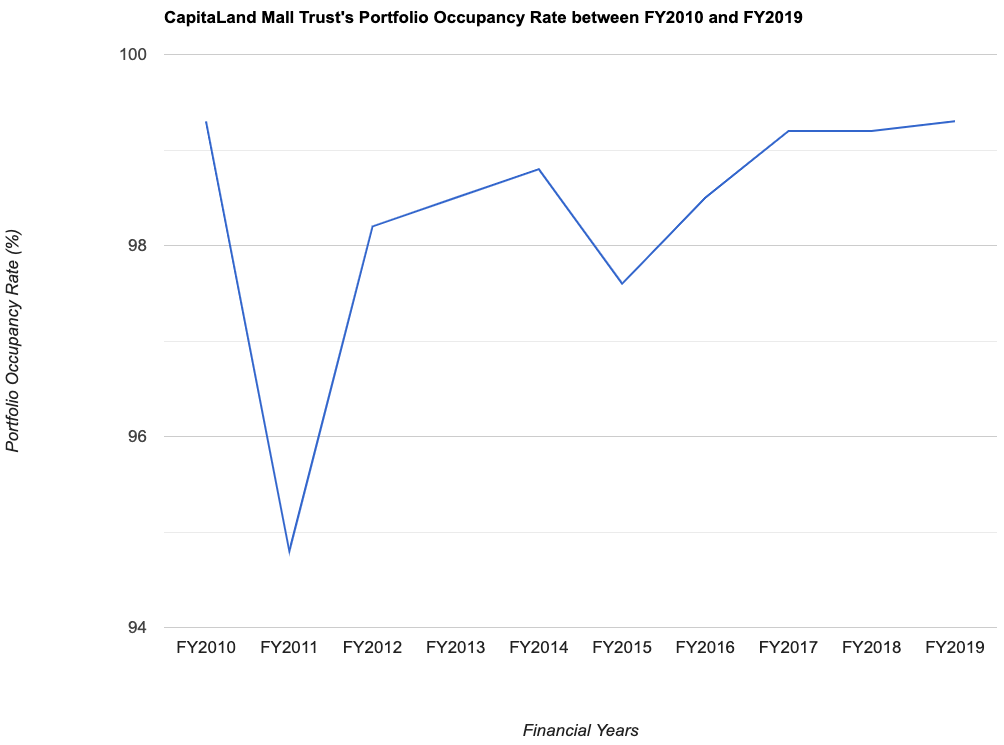
My Observations: I am happy to note that for most of the years (over a 10-year period), the REIT have been able to maintain its overall portfolio occupancy rate at above 98.0%.
However, in terms of its rental reversion, since FY2015, I noticed it has been on a downward trend – from above +6.0% in the years before to just +3.7% in FY2015, and then down to less than +1.0% in the latest financial year under review (i.e. FY2019.) This is largely due to the increase in the number of new retail malls in Singapore over those years. However, with lesser new malls coming up in the years ahead, it is possible that we may see CapitaLand Mall Trust’s rental reversion going back up once again. Let us have a look at it again in time to come.
Debt Profile of CapitaLand Mall Trust between FY2010 and FY2019
Before I invest in any company, I will first make sure that I study its debt profile to make sure that it is not overly leveraged, and that there is still some debt headroom available for the company to make new yield accretive acquisitions whenever a good opportunity comes along.
With that, let us now take a look at CapitaLand Mall Trust’s debt profile over a 10-year period (between FY2010 and FY2019):
| FY2010 | FY2011 | FY2012 | FY2013 | FY2014 | |
| Gearing Ratio (%) | 35.9% | 38.4% | 36.7% | 35.3% | 33.8% |
| Interest Coverage Ratio (times) | 3.6x | 3.3x | 3.2x | 4.2x | 4.5x |
| Average Term to Debt Maturity (years) | 2.6 years | 2.7 years | 3.9 years | 3.6 years | 4.7 years |
| Average Cost of Debt (%) | 3.7% | 3.5% | 3.3% | 3.4% | 3.5% |
| FY2015 | FY2016 | FY2017 | FY2018 | FY2019 | |
| Gearing Ratio (%) | 35.4% | 34.8% | 34.2% | 34.2% | 32.9% |
| Interest Coverage Ratio (times) | 4.8x | 4.8x | 4.8x | 5.2x | 4.7x |
| Average Term to Debt Maturity (years) | 5.3 years | 5.3 years | 4.9 years | 4.4 years | 5.0 years |
| Average Cost of Debt (%) | 3.3% | 3.2% | 3.2% | 3.1% | 3.2% |
My Observations: Looking at the REIT’s gearing ratio over the years, it seems to me that they are trying to maintain it at around 35.0%. In the latest financial year under review (i.e. FY2019), its gearing ratio, at 32.9%, is the lowest in 10 years – and plenty of debt headroom for it to make further yield accretive acquisitions before it reaches the regulatory limit of 45.0%.
In terms of the REIT’s average cost of debt, it has been consistent as well over a 10-year period.
All in all, I am happy with how the REIT have maintained its debt profile at a consistent level over the years.
Distribution Payout to Unitholders over a 10-Year Period (between FY2010 and FY2019)
Finally, one of my conditions in investing in a company is that, the company must be one that pays an increasing amount of dividends to us shareholders over the years. Also, my preference is towards companies that pays out dividends to shareholders on a quarterly basis.
As far as distribution payouts to unitholders by CapitaLand Mall Trust is concerned, it pays out distributions to unitholders on a quarterly basis, and moving into the new financial year ahead (i.e. FY2020), I understand that the REITY will continue to pay out a distribution to unitholders on a quarterly basis,
So, how has CapitaLand Mall Trust beeb rewarding its shareholders over the years? Let us find out below:
| FY2010 | FY2011 | FY2012 | FY2013 | FY2014 | |
| Distribution Per Unit (S$’cents) | 9.24 cents | 9.37 cents | 9.46 cents | 10.27 cents | 10.84 cents |
| FY2015 | FY2016 | FY2017 | FY2018 | FY2019 | |
| Distribution Per Unit (S$’cents) | 11.25 cents | 11.13 cents | 11.16 cents | 11.50 cents | 11.97 cents |

Apart from FY2016, where the distribution per unit was down slightly compared to the previous year, due to the retention of capital distribution and tax-exempt income received from CapitaLand Retail China Trust for general corporate and working capital purposes, all the other years saw y-o-y improvements. Over the years, the REIT’s distribution per unit to unitholders grew at a CAGR of 2.6%.
In Conclusion
As you can see from the sections above, its improving financial performances over the years, stable portfolio occupancy rate and debt profile, along with an increasing distribution per unit payout to unitholders are reasons why this retail REIT is in my long-term investment portfolio.
I also see the proposed merger with CapitaLand Commercial Trust a positive one for the REIT, and am confident of the REIT recording even better results in the years ahead.
As I have invested in the REIT at S$2.32 on 28 February (which equates to a yield of 5.2% based on a total distribution payout of 11.97 cents/unit in FY2019), one question that may be in your mind as you’re reading this post right now is whether or not I’d be averaging down, considering that the REIT is now trading at just S$1.93 at the time of writing – down 16.8% from my buy price.
Personally, I feel the REIT’s unit price could tumble further in the near-term due to headwinds relating to Covid-19. As such, I’ll be continuing to monitor the price moments of the REIT at this point in time, and make a decision in due course, when the situation stabilises.
Disclaimer: At the time of writing, I am a unitholder of CapitaLand Mall Trust.
Catch Me "Live" at the REITs Symposium 2024 - the Largest REIT Event in Singapore!

I am absolutely honoured to be invited to contribute to not just 1, but 2 segments in this year's REITs Symposium (held on Saturday, 11 May 2024 at Suntec Convention Centre Level 3, Summit 1 & 2 between 9am and 5pm), with the schedule as follows:
- From 2.00 to 2.30pm, I'll be at the Engagement Stage presenting "REITs 101: Winning in an Investing Marathon."
- Then, from 4.05 to 4.50pm, I'll join forces with REIT specialist Kenny Loh and Thomas Chua from Steady Compounding in a panel session on the Main Stage to delve into "Can You Retire Early and How?"
Take advantage of these special discount codes for exclusive savings:
- Use REITS24 for a 50% discount on individual tickets, now only $5 (Regular Price: $10)
- Use RBUDDY for a 60% discount on tickets for two, priced at just $8 (Regular Price: $20)
You can find out more about the event and secure your seat here.
Many thanks for your support and advance, and I hope to see you at the event! :)
Get Your Daily Dose of the Latest on US & SG-listed Companies (Updated Every Weekday)
Stay updated on the latest trends and developments for companies listed on the Singapore and US stock markets by visiting The Singaporean Investor's Substack page for daily updates. Check it out here...
Are You Worried about Not Having Enough Money for Retirement?
You're not alone. According to the OCBC Financial Wellness Index, only 62% of people in their 20s and 56% of people in their 30s are confident that they will have enough money to retire.
But there is still time to take action. One way to ensure that you have a comfortable retirement is to invest in real estate investment trusts (REITs).
In 'Building Your REIT-irement Portfolio' which I've authored, you will learn everything you need to know to build a successful REIT investment portfolio, including a list of 9 things to look at to determine whether a REIT is worthy of your investment, 1 simple method to help you maximise your returns from your REIT investment, 4 signs of 'red flags' to look out for and what you can do as a shareholder, and more!

You can find out more about the book, and grab your copy (ebook or physical book) here...


Comments (22)