Since my launch of the second version of “The Singaporean Investor”, and after my announcement that I will be including technical analysis posts in the site, I have received a couple of requests for me to share my technical analysis of the various companies.
After some consideration, here’s what I’d be doing – at the start of every week (i.e. on Monday, if I’m not away on a break), I’ll be taking a look at all 30 companies in the STI, and then do a simple technical analysis of their possible price movements in the week ahead, based on its share price movements on a weekly timeframe.
I hope you’ll find this new segment useful and if you have any comments or suggestions on how I can better improve this one, do feel free to let me know by dropping me a message here.
Now, let us take a look at how each of the 30 companies in the STI may see its share price move in the week ahead:
1. Ascendas REIT (SGX:A17U)

After a bullish run the week before, the bears came in and pulled the price down to $3.01 (its closing share price last Friday.) In terms of trading volume, last week’s trading volume was slightly higher than the week preceding it. Also, looking at the MACD, it looks like it is going to cross downwards into a downtrend. That said, I personally feel that its unit price may continue to weaken in the week ahead, where it will attempt to test the support line at S$2.89. However, in a bullish case scenario, the unit price may attempt to test the S$3.02 resistance level once again.
2. CapitaLand (SGX:C31)
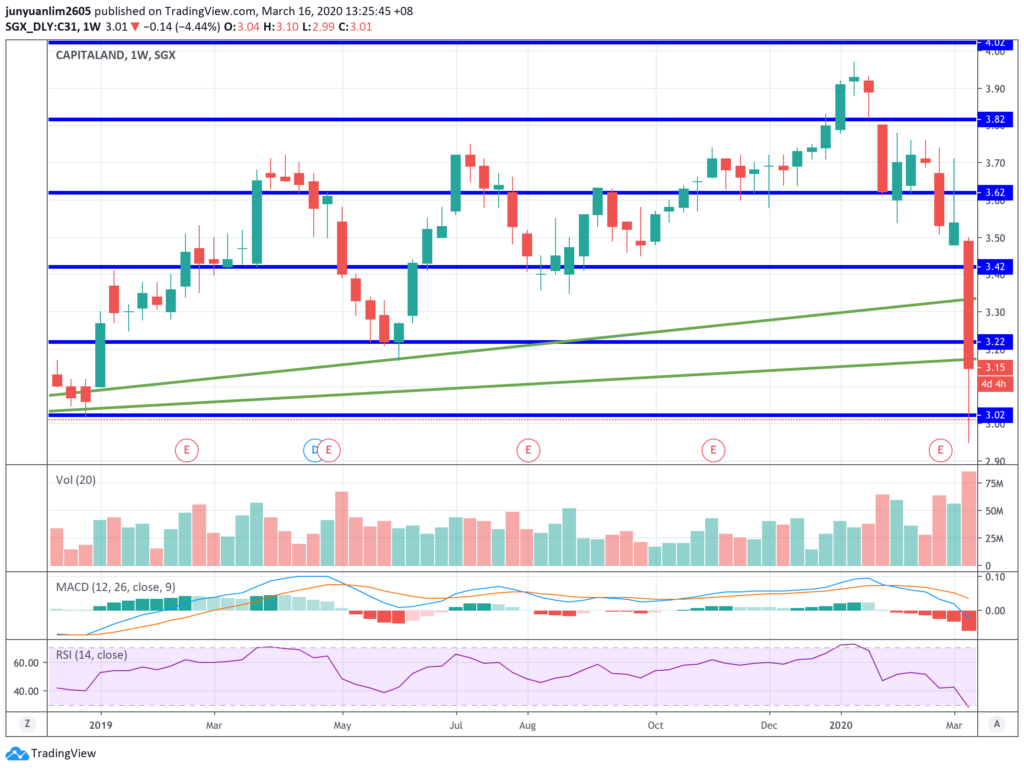
CapitaLand’s share price suffered a pulldown last week, where it slumped from a high of S$3.50 to a low of S$2.95, before closing at S$3.15 for the week ended 13 March. Looking at its higher than average trading volume for the week, along with the fact that MACD is in a downtrend position, the share price of CapitaLand may very well continue to weaken in the week ahead – it may attempt to test the support at S$3.02 once again, and if it breaks down once again, the share price may end the week below S$3.00. If there is any pull back up by the bulls, then it may test the resistance line at S$3.22.
3. CapitaLand Commercial Trust (SGX:C61U)

Last week was a pretty bullish one for CapitaLand Commercial Trust, where its unit price was pulled up from a low of S$1.82 to a high of S$2.07, before closing at S$2.01. In terms of its trading volume, its also higher than average. However, its MACD is still in a downtrend. As such, 2 scenarios could happen in the week ahead – in a bullish scenario, the share price could trend even higher and test the S$2.13 resistance line; in a bearish scenario, the share price could once again test the support line at S$1.87.
4. CapitaLand Mall Trust (SGX:C38U)

Following a pull back up by the bulls the week before, the bears came back again to pull the retail REIT’s unit price down once again, where it closed at S$2.18 last Friday (13 March). The only thing is that, the trading volume is slightly lesser than the week immediately preceding it, even though MACD continues to be in a downtrend. In the week ahead, its unit price may test the support level at S$2.12, or if there’s a pull back up by the bulls once again, it may test the resistance level at S$2.22.
5. City Developments (SGX:C09)

In the week that just ended, City Development’s share price fell from a high of S$9.37 to a low of S$7.88, before closing at S$8.28 last Friday. Looking at its higher than average trading volume for the week, and also the fact that MACD is still in a downtrend, it is very likely that the share price of City Developments may see its share price sliding lower in the week ahead – should it break down the support line at S$8.23, the next support line is at S$7.56. However, should there be any pull back up, the next resistance line is at S$8.90.
6. ComfortDelGro (SGX:C52)

The share price of ComfortDelGro have been falling for 4 straight weeks, at a high trading volume. Also, the MACD is in a downtrend. All these suggests that the bears are in full control of this one, and the share price may continue to fall in the week ahead – it could test the next support line at $1.43.
7. Dairy Farm International (SGX:D01)

The share price of Dairy Farm International have closed lower than its previous week for 4 consecutive weeks. Also, looking at the trading volume over the same time period, it has been increasing, suggesting that the bearish run is set to continue. In the week ahead, the share price could test the support line at US$3.84. However, should there be a bounce back up, then its share price could test the resistance line at US$4.36.
8. DBS Group Holdings (SGX:D05)

For the past 4 weeks, DBS’ share price have closed lower than the preceding week – suggesting that its share price movement is in very bearish state. Also, looking at the trading volume over the past 4 weeks, it has been increasing, suggesting that the bearish run is set to continue. In the week ahead, its share price may re-test the support level at S$18.67, and if it breaks down lower from here, the next support level is at S$17.59. However, should there be any bounce back up, the next resistance line is at S$19.75.
9. Genting Singapore (SGX:G13)
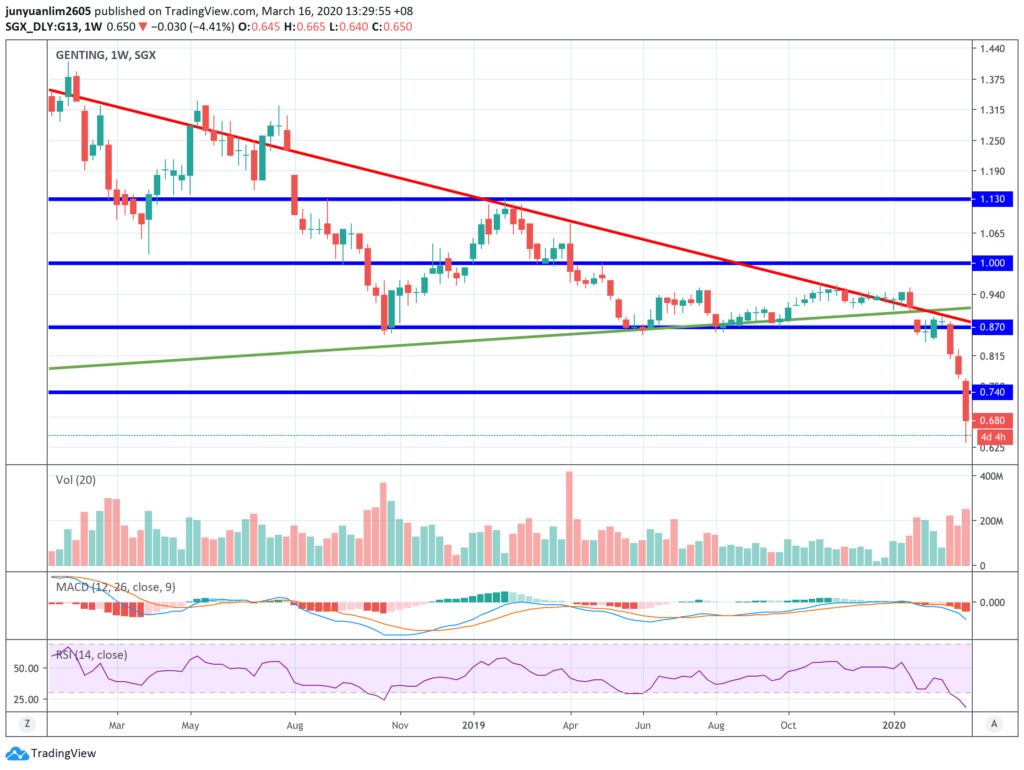
For the past 3 weeks, Genting Singapore’s share price have ended lower – forming what is called a “three black crows” candlestick formation – a bearish signal. Genting Singapore’s share price ended the previous week below the $0.740 support line, with MACD in a downtrend, and RSI in oversold territory. Should the share price of the company continue to slide (which is most likely the case, looking at the “three black crows” candlestick formation), the next level of support is at S$0.61. However, should the price weakness weakens and bounce back up, it may test the support turned resistance line at S$0.740.
10. Hongkong Land (SGX:H78)
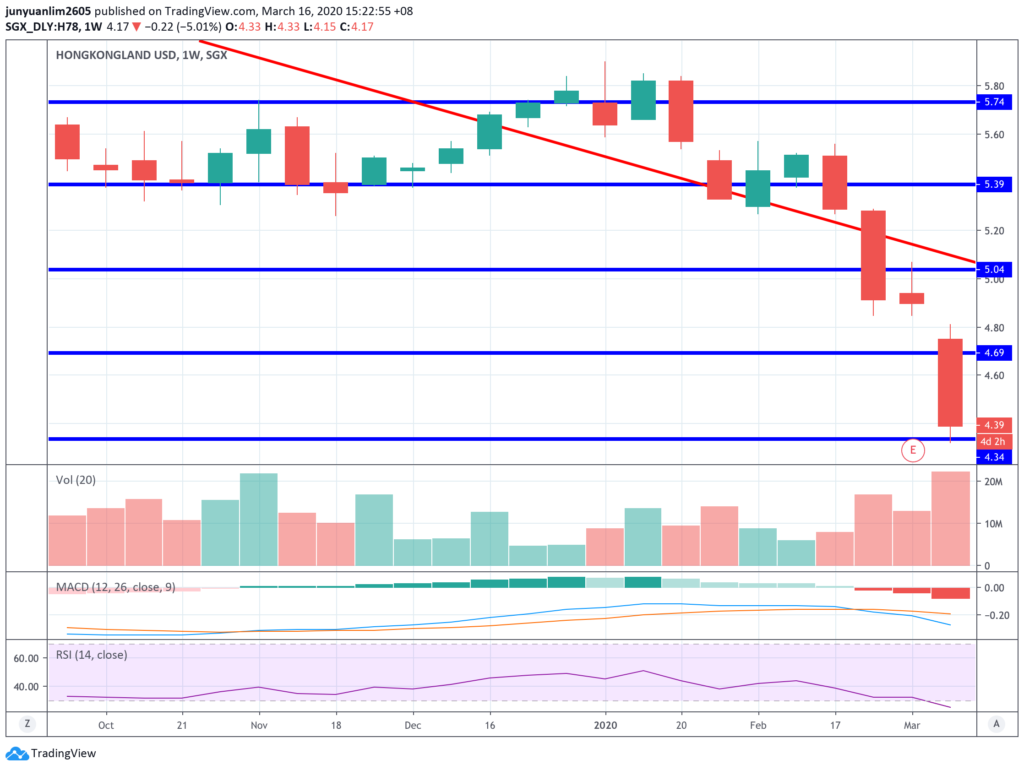
Hongkong Land have seen its share price slip for 4 consecutive weeks, and in the most recent week that ended, its share price closed at US$4.39. Looking at its trading volume (where its most recent week’s trading volume is higher than average), plus the fact that its MACD is in a downtrend, it is highly likely that the downward fall will continue in the week ahead. Should it drop below the US$4.34 support line, the next level of support is at US$3.99. However, should there be any bounce up in its share price, it could test the resistance line at US$4.69.
11. Jardine Cycle & Carriage (SGX:C07)
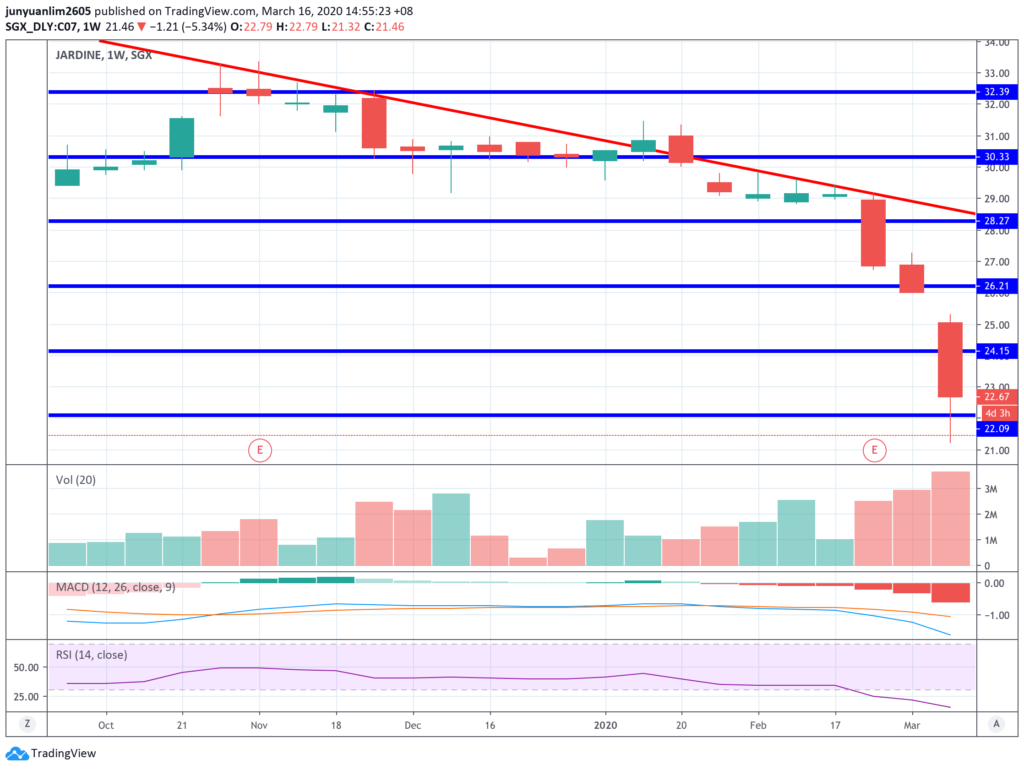
For 3 consecutive weeks, Jardine Cycle & Carriage’s share price have saw lower closing prices compared to the previous week. Also, looking at the trading volume for the same time period, it has been increasing gradually, suggesting that the downward fall in its share price may very well continue in the week ahead – where it could test the support line at US$22.09. However, should there be any bounce up in its share price, the most immediate resistance line is at US$24.15.
12. Jardine Matheson Holdings (SGX:J36)

The most recent week that ended on 13 March saw a bullish hammer candlestick formation, on a higher trading volume last week. However, its MACD have just turned downwards into a downtrend. In my opinion, in the week ahead, this one could go enter way – in a bullish scenario, the share price could test the US$54.90 resistance line; in a bearish scenario, the share price could test the US$49.75 support line.
13. Jardine Strategic Holdings (SGX:J37)

The share price of Jardine Strategic have closed lower in 4 consecutive weeks – and looking at the trading volume, for the same time period, it has been on an increasing trend. Also, its MACD have also turned downwards into a downtrend. All these suggests to me that the share price of this one could continue to weaken in the week ahead – where it will test the support at US$22.80, should it break below its most immediate support at US$24.90. However, should the share price were to climb back up, it could re-test the resistance line at US$27.00.
14. Keppel Corporation (SGX:BN4)

The candlestick patterns over the past 3 weeks forms what is called a “three black crows” candlestick pattern. Along with the higher-than-average trading volume, and that MACD is in a downtrend, it seems to me that the downward fall in the share price of Keppel Corporation is set to continue in the week ahead, where it may fall to the next support line at S$4.72. However, should there be any pull back up, it may test the resistance line at $5.24.
15. Mapletree Commercial Trust (SGX:N2IU)

The most 2 weeks of candlestick pattern resembles a “bearish engulfing” candlestick formation to me – suggesting that the week ahead is likely to be a bearish one. Other signs that confirms this is its higher trading volume for the week that just ended last Friday, along with the fact that MACD is in a downtrend. The week that ended 13 February saw the retail REIT’s unit price close at its support line at S$2.07. Should it break below this line on a high volume, then the next support level is at S$1.97. On the flip side, if there are any pull back, then the unit price may attempt to test the resistance line at S$2.17.
16. Mapletree Logistics Trust (SGX:M44U)

Following some pull back up in the week before, the most recent week that just ended on 13 March saw its unit price being pulled down once again, where it closed at S$1.73, just one cent above the support line at S$1.72. As the week’s trading volume is higher than the average, and also the fact that MACD is about to cross downwards into a downtrend, it is highly likely that the unit price of the logistics REIT may trend lower in the week ahead – where it may attempt to test the next support line at S$1.62 (should it break below the most immediate support line at S$1.72.) However, should there be any pull back up, then its unit price may test the resistance line at S$1.79.
17. OCBC (SGX:O39)
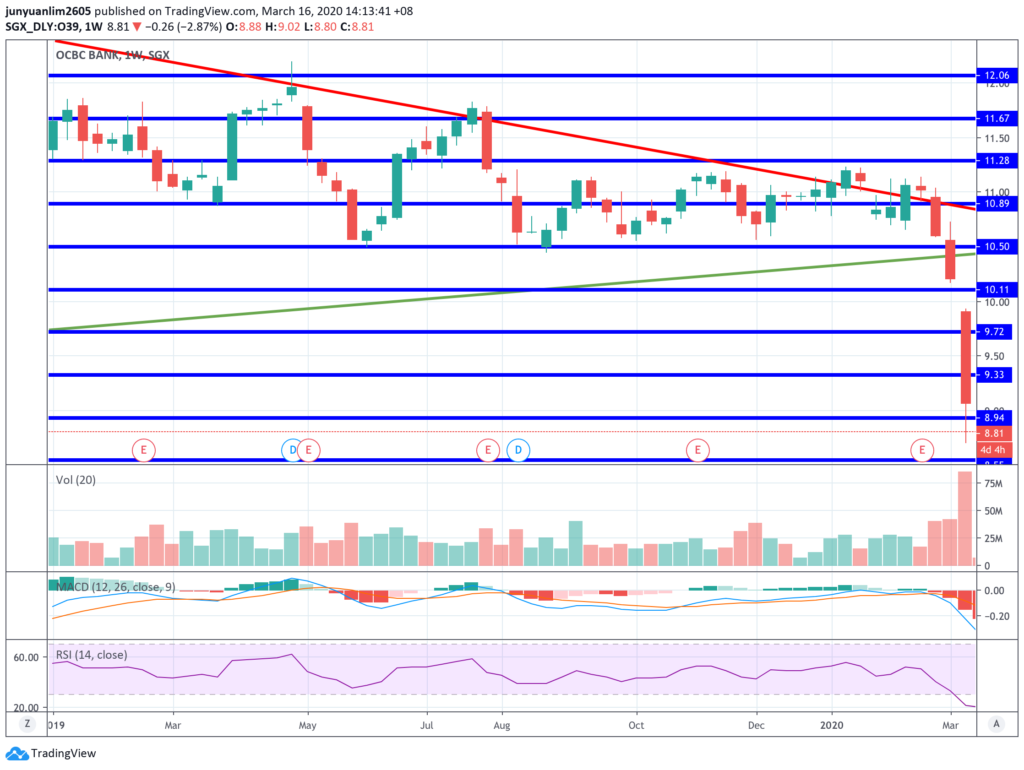
OCBC’s share price have closed lower for 4 consecutive weeks. Considering that for the same time period, its trading volume have increased, and that its MACD is deep into a downtrend position, it’s very likely that the share price of the bank will plunge even further in the week ahead. It may attempt to test the support line at S$8.94 once again, and if it breaks down further, the next support line is at S$8.55.
18. SATS (SGX:S58)

Looking at the share price movements for the past couple of weeks, you can see that the overall trend is down – its MACD also suggests likewise. In the most recent week that ended, its share price closed at S$3.60, a few cents away from the support line at S$3.56. In the week ahead, I foresee the share price of SATS will continue to slump, and if it breaks below the support line at S$3.56, the next support line will be at S$3.36.
19. Sembcorp Industries (SGX:U96)

Sembcorp Industries’ share price have saw 4 consecutive weeks of slump. It closed at S$1.64 last Friday (13 March.) Looking at the higher than average, and also increasing trading volumes over the past 4 weeks, and that its MACD is deep in a downtrend position, it is highly likely that the company’s share price will continue to trend lower in the week ahead – where it will attempt to test the support line at S$1.49. However, should there be some pull back, then the share price may attempt to test the resistance at S$1.70.
20. SGX (SGX:S68)

After some pull back up in the week before the last, its share price slumped once again, where it closed at S$8.47, just a few cents away from the support line at S$8.44. However, the trading volume for the last week is much higher than average, and also MACD is in a downtrend. As such, I feel that its share price may further weaken in the week ahead, where it may very likely break down the S$8.44 support line to the next support line at S$8.10.
21. SIA (SGX:C6L)

SIA is one of the many blue chip companies that have seen its share price closing lower for 4 consecutive weeks. Looking at its trading volume (which is higher than average), and its MACD (which is deep in a downtrend position), its share price could slump further – should it break below the support line at S$7.02, the next support level is at S$6.62. However, should there be any pull back up, it could test the resistance at S$7.42.
22. SingTel (SGX:Z74)
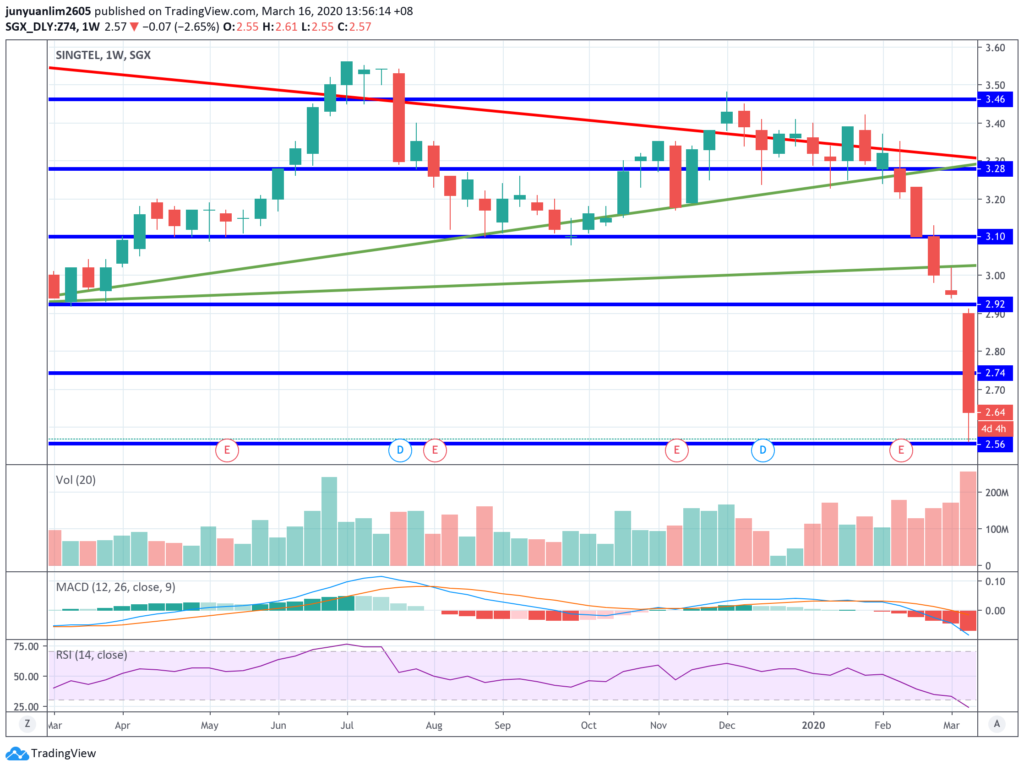
For 5 consecutive weeks, SingTel’s share price have closed lower than the preceding week, suggesting that the company’s share price movement is now in a bearish mode. Also, looking at how the trading volume for the past 5 weeks have been trending upwards, and the fact that MACD is in a downtrend, I personally feel that in the week ahead, SingTel’s share price may continue to trend even lower – where it may attempt to retest the S$2.56 support line. However, should there be any bounce up, the next level of resistance is at S$2.74.
23. SPH (SGX:T39)

For the most recent week that ended, the candlestick pattern is a doji, suggesting that the bulls and bears are “on par”. However, its MACD is still in a downtrend position. In my personal opinion, this one could move either way in the week ahead – in a bullish scenario, it could test the resistance line at S$1.95; in a bearish scenario, it could test the support line at S$1.80.
24. ST Engineering (SGX:S63)
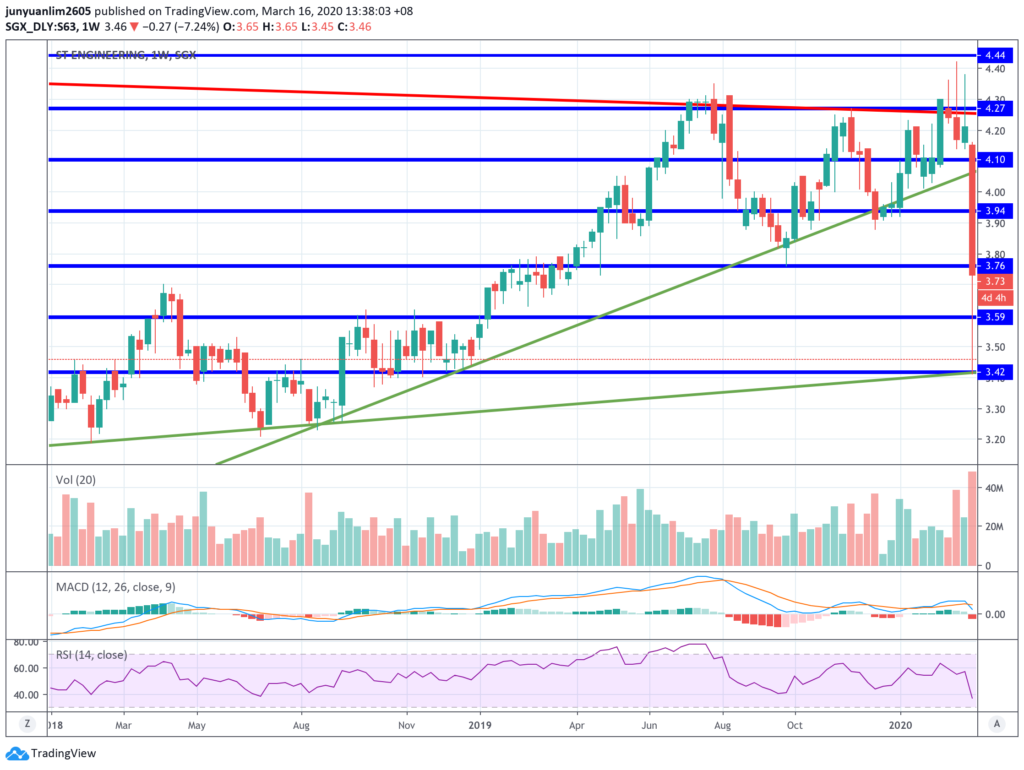
ST Engineering’s share price also suffered a huge drop in the last week, where it fell from a high of S$4.16 to a low of S$3.41, before ending the week at S$3.73. As MACD have just crossed into a downtrend position, I feel that the company’s share price may continue to weaken in the week ahead, where it may once again re-test the support lines at $3.59, and S$3.42. However, in a bullish scenario, it may re-test the resistance lines at S$3.76, and S$3.94.
25. ThaiBev (SGX:Y92)

Last week was a bearish one for ThaiBev, as its share price was pulled down from a high of S$0.770 to a low of S$0.625, before closing at 0.650 for the week. The fact that its trading volume for the week was also higher than average, plus its MACD continued to be in a downtrend suggests that in the week ahead, ThaiBev’s share price may continue to trend lower – it may attempt to test the support at S$0.595, or if there’s any pull back up, it may test the resistance at S$0.675.
26. UOB (SGX:U11)

The share price of UOB have slipped for 4 consecutive weeks. Trading volume have also increased for the same time period, suggesting that the bears are in total control of this one as well. Looking at its MACD, it’s also in a downtrend position. All these suggests that in the week ahead, the bank’s share price is very likely to trend lower, and test the S$18.92 support line. Should this support line be broken down, the next support line is at S$17.47.
27. UOL (SGX:U14)

The candlestick formation for the week that ended on 13 March is a “inverse hammer”, suggesting that its share price may reverse into an upward trend in the week ahead. That said however, its MACD is still in a downtrend position. As such, two scenarios could happen in the week ahead – in a bullish scenario, the company’s share price could re-test the resistance line at S$7.31, and if it can break past this price point at a high trading volume, then the next resistance line is at S$7.79; in a bearish scenario, its share price could slip down to the support line at S$6.83.
28. Venture Corporation (SGX:V03)

Last week was a bearish one for Venture Corporation, as the share price pulled from a high of S$16.95 to a low of S$14.88, before closing at S$15.31. Looking at the week’s trading volume (which is higher than usual), MACD, and RSI, for the week ahead, the share price may test the support line at S$14.65. Should the share price drop below this support line, then the next support line is at S$13.30. However, if there’s a pull back up, the share price may test the resistance line at S$16.00.
29. Wilmar International (SGX:F34)

The share price of Wilmar International suffered a huge fall the previous week – where it slumped from a high of S$3.91 to a low of S$3.14, before closing at S$3.40. Trading volume was also higher than average for the week, and MACD is also in a downtrend position. That said, in the week ahead, I feel that the share price of Wilmar will continue the downtrend momentum where it may once again re-test the support levels at S$3.28, or S$3.15 once again (just like last week.) However, should the bulls were to come in and pull the share price up, it may test the resistance level at S$3.54.
30. Yangzijiang Shipbuilding (SGX:BS6)
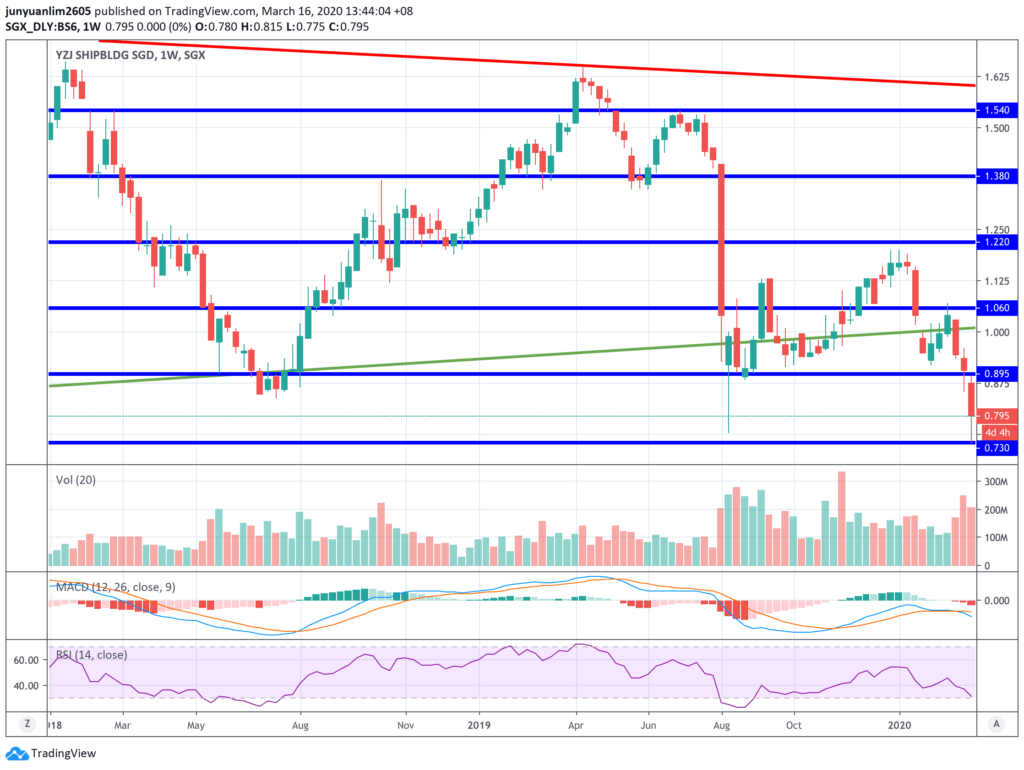
Just like the share price movements of Genting Singapore earlier, we see a formation of a “three black crows” candlestick pattern, suggesting that the bearish trend is set to continue this week. Its share price may attempt to once again re-test the support line at S$0.730. However, should there be any bullish pull back up, it may test the resistance line at S$0.895.
Disclaimer: Please note that the above sharing is for your educational purposes only, and it does not imply any buying/selling calls for any of the companies above. At the time of writing, I am a shareholder of Ascendas REIT, CapitaLand Mall Trust, ComfortDelGro, DBS, SATS, SIA, SingTel, OCBC, and UOB.
Are You Worried about Not Having Enough Money for Retirement?
You're not alone. According to the OCBC Financial Wellness Index, only 62% of people in their 20s and 56% of people in their 30s are confident that they will have enough money to retire.
But there is still time to take action. One way to ensure that you have a comfortable retirement is to invest in real estate investment trusts (REITs).
In 'Building Your REIT-irement Portfolio' which I've authored, you will learn everything you need to know to build a successful REIT investment portfolio, including a list of 9 things to look at to determine whether a REIT is worthy of your investment, 1 simple method to help you maximise your returns from your REIT investment, 4 signs of 'red flags' to look out for and what you can do as a shareholder, and more!

You can find out more about the book, and grab your copy (ebook or physical book) here...


Comments (0)